

Alelo
OperatingAlelo Inc.
Software & AI · Los Angeles, CA · Founded 2006
Artificial Intelligence Avatar-Based Training
Financials
FY2018–FY2023 · from SEC filings · hover any figure for its sourceFigures as reported by the issuer in the filing shown on hover. Each year’s pill shows the assurance level of its filed statements — audited, reviewed (CPA review, less than an audit), or unaudited, as the filing’s own report or certification states it. A dashed pill marked * is inferred instead: the SEC minimum for an offering that size, which the issuer may have exceeded. No pill means we couldn’t tell. Headcount is the filing’s point-in-time count, not a year-end average. Manually corrected figures are marked “Corrected”.
Valuation over rounds
Pre-money — the valuation set before each round’s money came inBlue bars are the pre-money valuation the company stated for a priced round.
Share price over rounds
Disclosed sales come from the issuer's own filings (prior-offering lines, audited-statement notes) and are amount ÷ securities sold. A down round is a firm point more than 25 % below the previous firm point of the same share class on a comparable basis; the comparison ignores unverified and year-only lines.
Fundraising history
Team
9 people
Dr. Johnson is an internationally recognized expert in AI in education. For his work on the the first Alelo immersive game, Tactical Iraqi, he won DARPA's Significant Technical Achievement Award. He has been a past President of the International AI in Education Society, and was co-winner of the 2017 Autonomous Agents Influential Paper Award for his work in the field of pedagogical agents. He has been invited to speak at international conferences such as the International Conference on Intelligent Tutoring Systems, and presented a Distinguished Lecture at the National Science Foundation.

Cliff Kamida has over twenty years of experience in interactive media production. Prior to joining Alelo as Senior Project Manager for Alelo’s Virtual Cultural Awareness Trainers (VCATs), Mr. Kamida produced computer and video games for Knowledge Adventure and the Walt Disney Company, and was Director of Partner Implementation at NearU Search, a mobile marketing company. He has also taught courses in Game Design and Game Production Management at National University. He received his B.A. in Journalism from the University of Hawaii.

Eli Eisenberg has 40 years of experience in Accounting and Financial management, including working with start-up and early stage companies since 1979. He founded Straight Line Management in 1991 to provide services as acting/interim CFO for more than 60 early stage companies and numerous financings. Eli works as a consultant for Alelo, Inc. as Interim CFO.
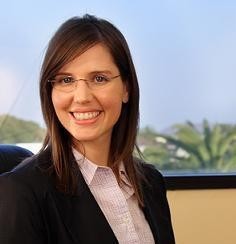
Dr. Alicia Sagae is a specialist in Natural Language Processing with over 15 years of experience as a Scientist and Principal Investigator. She has executed and published work on a variety of topics in Artificial Intelligence. These include Machine Translation, Text Classification, Textual Reasoning, BioNLP, and AI for Education. Since 2008 Dr. Sagae has helped the Alelo team to develop critical new technologies, such as personalized skill assessments for learners and AI-driven language interpretation. These technologies strengthen Alelo's role as a leader in Intelligent Systems for Education and Training.

Ms. Lindsay is a Senior Project Manager at Alelo Inc. Ms. Lindsay has collaborated with corporate, government and higher education clients to create successful language and culture products. She also provided management support for the creation and deployment of Alelo's educational portal and back-end systems. Prior to coming to Alelo, Ms. Lindsay worked in the educational software field for nine years. She holds an MBA from Pepperdine University and a Project Management Professional (PMP) certificate.

Karen Chiang has been involved in language learning and testing in academic and workplace applications for over 30 years. Prior to working with Alelo she was VP of sales at Pearson and was responsible for talent solutions and commercialization of the Versant language assessment products which utilize automated scoring. Karen has experience in international and business development in emerging markets such as India.

Richard has been an entrepreneur in the life-science and healthcare industries since the 1980s. He was president of the Los Angeles Venture Association and the Technology Council of Southern California; and advisor to the Wells Fargo Center for Entrepreneurship, California State University (Northridge) and the California Emerging Technology Fund. He holds degrees from the Massachusetts Institute of Technology and the University of California, Berkeley. He lives with his wife in Los Angeles where he has followed a keto lifestyle since 2010 and avidly practices yoga.

Thomas Lyman Chun is a private investor. He served previously on the board of directors of Maxtor Corporation (NYSE) and on the board of advisors of Logitech International S.A. (NASDAQ). He was also a founder and first chairman of the board of the Corporation for Open Systems, a consortium of America’s leading computer and communications companies, and served as an industry spokesman to technology companies and the press in Europe, Asia and the U.S.. Mr. Chun was a vice president of Tandem Computers (NASDAQ) and SyQuest Technology (NASDAQ) as well as a founder and CEO of several start-ups. He holds a BA from Yale, a JD from Harvard, and an MBA from Stanford, and he studied international economics in the doctoral program at the Ecole de Hautes Etudes en Sciences Sociales in Paris. He has been a lifetime language learner and has studied French, Spanish, Chinese, Russian, Italian, German and Arabic through a variety of online and classroom methods.
Names and titles as disclosed on StartEngine, SEC Form C. Bios and photos come from the platform campaign page and may be out of date.
Reg CF annual-report compliance
Filed 4 of 6 annual reports (FY2020–FY2025)
Reg CF issuers must file a Form C-AR each year until a Rule 202(b) termination trigger is met.
SEC filings
View all 16 filings on EDGAR- Form C-ARApr 16, 20240001665160-24-000363EDGAR
- Form C-ARMay 1, 20230001665160-23-001134EDGAR
- Form C-UOct 6, 20220001665160-22-002658EDGAR
- Form C-ARApr 26, 20220001665160-22-000845EDGAR
- Form C-AR/ADec 27, 20210001665160-21-002346EDGAR
- Form C-UAug 31, 20210001665160-21-001562EDGAR
- Form C/AJul 26, 20210001665160-21-001308EDGAR
- Form C/AApr 30, 20210001665160-21-000860EDGAR
About this data. Figures are compiled from public sources — SEC EDGAR filings (Form C, C-AR, 1-A, 1-K) and funding-platform pages — and may be delayed, incomplete, or restated by the issuer. Financial statements are as reported by the issuer; each year is labeled with its assurance level (audited / reviewed / unaudited). A valuation cap is the conversion ceiling of a SAFE or convertible note, not an agreed company valuation; post-money figures are computed as pre-money plus amount raised and are not a traded price. Crowdonomics is not a broker-dealer, funding portal, or investment adviser; nothing here is investment advice or an offer to sell securities. Verify all figures against the linked EDGAR filings.