
AMASS
PublicAMASS BRANDS
Food & Beverage · Los Angeles, CA · Founded 2016
Portfolio of premium, high-growth botanic beverages and self care products
Financials
FY2018–FY2024 · from SEC filings · hover any figure for its sourceFigures as reported by the issuer in the filing shown on hover. Each year’s pill shows the assurance level of its filed statements — audited, reviewed (CPA review, less than an audit), or unaudited, as the filing’s own report or certification states it. A dashed pill marked * is inferred instead: the SEC minimum for an offering that size, which the issuer may have exceeded. No pill means we couldn’t tell. Headcount is the filing’s point-in-time count, not a year-end average. Manually corrected figures are marked “Corrected”.
Valuation over rounds
Pre-money — the valuation set before each round’s money came inBlue bars are the pre-money valuation the company stated for a priced round. Dotted grey bars are our estimate for rounds that didn't state one: the round's share price × the shares outstanding in its filings. Same measure as blue, but rougher.
Share price over rounds
“Today's shares” restates every price in the share terms current now, so a price before a split or an LLC→corporation conversion is divided by that event's ratio (each event is cited on the round page). Disclosed sales come from the issuer's own filings (prior-offering lines, audited-statement notes) and are amount ÷ securities sold. A down round is a firm point more than 25 % below the previous firm point of the same share class on a comparable basis; the comparison ignores unverified and year-only lines, and each class is drawn as its own line.
Cap table
Share counts as of Mar 31, 2026| Class | Outstanding | Votes / share | Share of total | Votes | Liquidation | Last price |
|---|---|---|---|---|---|---|
| Common stock | 3,600,420 | none | 100.0% | — | paid 3rd | — |
Shares outstanding over timein today's share terms
Principal holders% as the filing states it, Aug 30, 2024
- Desmond J. Lynn3,450,000 Common Stock21.8%of
Sold to the crowd
- Reg CF · Mar 2021127,508 shares at $11.60 in today's terms · sold as 382,524 shares at $3.87; since then a 1-for-3 reverse split (Jan 2026)$1.5M· 1,021 investors
- Reg CF · Jan 202555,060 shares at $8.55 in today's terms · sold as 165,179 shares at $2.85; since then a 1-for-3 reverse split (Jan 2026)$470.8K
- Reg CF · Sep 202527,219 shares at $10.05 in today's terms · sold as 81,656 shares at $3.35; since then a 1-for-3 reverse split (Jan 2026)$273.5K
- Reg CF · Feb 20261,850 shares at $12.00$22.2K
From the company's SEC filings: share counts per class, each class's voting and conversion terms, and the holders of 20% or more that Form C requires (officers and 10%+ holders on Form 1-A). Filings name only large holders, so most owners — including crowd investors — are not listed, and a holder's percentage may be of its own class rather than of the whole company. Prices and crowd share counts are in today's share terms — adjusted for splits and conversions since they were sold. Hover a figure for its filing.
Fundraising history
Team
5 people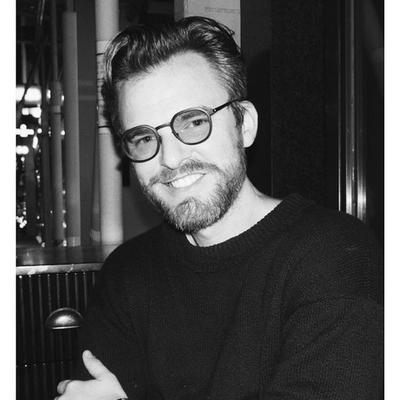
Mark Thomas Lynn, an Irish entrepreneur in LA and NYC, founded AMASS Brands Group, a diversified beverage company with brands like AMASS Botanics and Gem & Bolt Mezcal. He co-founded De Soi with Katy Perry and chairs Digital Brands Group. A leader in health-conscious, sustainable products.
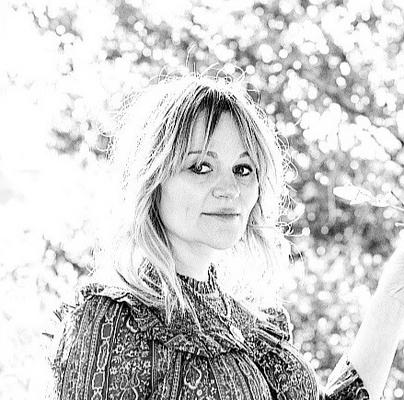
Morgan McLachlan grew up in the Canadian Pacific Northwest, where she spent many afternoons exploring the forest, forging what would become a lifelong fascination with plants. While she appreciates distilling tradition, she considers herself a punk rock distiller, experimenting with any and all plants, herbs, and spices that she can get her hands on. Her expertise in botanicals coupled with an encyclopedic knowledge of distilling are the driving forces behind AMASS.
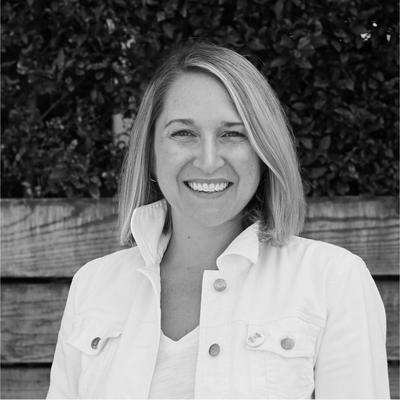
Erin joined us as our COO in January 2023. She is responsible for all operational functions of the business, compliance and oversees our national wholesale team. She previously served as COO of Winc. In her ten year tenure there, she built the wholesale distribution channel and scaled the sales team in addition to overseeing all day-to-day operations and the winemaking team. Previous to Winc, Erin worked at LivingSocial overseeing all deal operations and ran point on the Amazon partnership.
Names and titles as disclosed on StartEngine, SEC Form C. Bios and photos come from the platform campaign page and may be out of date.
Reg CF annual-report compliance
Filed 4 of 6 annual reports (FY2020–FY2025)
Reg CF issuers must file a Form C-AR each year until a Rule 202(b) termination trigger is met.
SEC filings
View all 33 filings on EDGAR- Form 10-QAug 14, 20260001575872-26-000579EDGAR
- Form 10-QJun 29, 20260001575872-26-000451EDGAR
- Form C-UApr 20, 20260001493152-26-018072EDGAR
- Form CFeb 25, 20260001493152-26-008005EDGAR
- Form C-UFeb 18, 20260001493152-26-007310EDGAR
- Form DJan 2, 20260001575872-26-000002EDGAR
- Form C/ANov 21, 20250001493152-25-024520EDGAR
- Form C/AOct 6, 20250001493152-25-017116EDGAR
About this data. Figures are compiled from public sources — SEC EDGAR filings (Form C, C-AR, 1-A, 1-K) and funding-platform pages — and may be delayed, incomplete, or restated by the issuer. Financial statements are as reported by the issuer; each year is labeled with its assurance level (audited / reviewed / unaudited). A valuation cap is the conversion ceiling of a SAFE or convertible note, not an agreed company valuation; post-money figures are computed as pre-money plus amount raised and are not a traded price. Crowdonomics is not a broker-dealer, funding portal, or investment adviser; nothing here is investment advice or an offer to sell securities. Verify all figures against the linked EDGAR filings.