

Aquipor
Raising nowOperatingAquipor Technologies, Inc.
Energy & Cleantech · Spokane, WA · Founded 2015
Revolutionizing Stormwater Systems
This company has an open fundraising round.
Financials
FY2018–FY2025 · from SEC filings · hover any figure for its sourceFigures as reported by the issuer in the filing shown on hover. Each year’s pill shows the assurance level of its filed statements — audited, reviewed (CPA review, less than an audit), or unaudited, as the filing’s own report or certification states it. A dashed pill marked * is inferred instead: the SEC minimum for an offering that size, which the issuer may have exceeded. No pill means we couldn’t tell. Headcount is the filing’s point-in-time count, not a year-end average. Manually corrected figures are marked “Corrected”.
Valuation over rounds
Pre-money — the valuation set before each round’s money came inBlue bars are the pre-money valuation the company stated for a priced round.
Share price over rounds
Disclosed sales come from the issuer's own filings (prior-offering lines, audited-statement notes) and are amount ÷ securities sold. A down round is a firm point more than 25 % below the previous firm point of the same share class on a comparable basis; the comparison ignores unverified and year-only lines.
Cap table
Principal holders% as the filing states it, May 12, 2026
- Frontier Assets, LLC4,500,000 Common Stock23.5%of votes
Sold to the crowd
- Reg CF · May 2020946,810 shares at $1.13$1.1M· 2,256 investors
- Reg CF · Aug 2021552,773 shares at $2.75$1.5M· 1,984 investors
- Reg CF · Jun 2023377,662 shares at $2.81$1.1M· 717 investors
- Reg CF · Dec 2024368,201 shares at $2.93$1.1M· 828 investors
- Reg CF · May 2026135,120 shares at $3.33$449.9K· 301 investors
From the company's SEC filings: share counts per class, each class's voting and conversion terms, and the holders of 20% or more that Form C requires (officers and 10%+ holders on Form 1-A). Filings name only large holders, so most owners — including crowd investors — are not listed, and a holder's percentage may be of its own class rather than of the whole company. Prices and crowd share counts are in today's share terms — adjusted for splits and conversions since they were sold. Hover a figure for its filing.
Fundraising history
Team
8 people
Greg is a committed founder and CEO with experience founding and running early-stage companies. Greg has managed early-stage product development teams, directed fundraising efforts, managed Intellectual Property strategies, and overseen back office operations. He provides both the vision and market expertise to lead AquiPor in helping solve major stormwater issues for cities and developers.

Kevin is a passionate cofounder with prior startup experience in the stormwater management industry. Kevin brings a great deal of market knowledge and experience to the space and has success developing the market around new stormwater products. Kevin has been responsible for the product and application testing of new building materials, directing engineers on data collection and ASTM testing to develop new product specifications. He also has product sales experience with architects, engineers, and contractors. Today, Kevin serves as V.P. of Market Development for AquiPor.
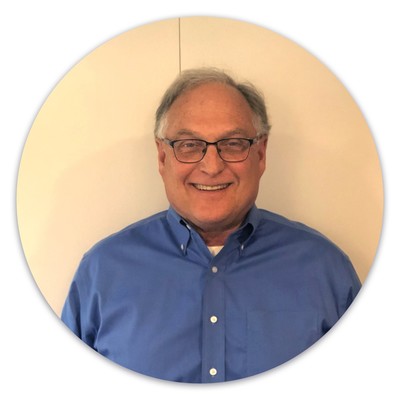
David Martin is the former Chief Operating Officer for Valley Hospital in Spokane, WA. Recently retired, David is an adept negotiator with a strong track record of successful contract negotiations as an executive in the insurance and healthcare industries. He has developed self-insured retention programs and handled complex medical malpractice and product liability claims as the Director of Risk Management at Empire Health Services. David brings tremendous experience as an operator and administrator to the AquiPor Board. He also has experience as an early-stage investor in various promising startups.

John has over 30 years of executive experience working in management roles for Intel, Novellus Systems, and most recently, Clearwater Paper. Most recently, as CFO for Clearwater Paper, a $1.5 Billion (revenue) public company, John established and implemented the company’s financial model and was responsible for two successful public debt offerings. At Novellus Systems, John was key in the company being acquired by Lam Research in 2012. John helped increase operating margin, net profit, and earnings per share in the span of two years as the company’s CFO. John is a member of AquiPor's Advisory Board.

Mark brings tremendous experience to the AquiPor advisory board. With over 28 years of management experience in construction and building materials, Mark’s family’s business, CPM Development Corp (Central Pre-Mix), was acquired by Oldcastle Materials (CRH plc) in 1997. After the acquisition, Mark worked as regional president for Oldcastle, managing over 500 employees in 4 companies with over $200M in sales throughout. He also spent 6 years leading a National Performance Team for Oldcastle that drove innovation in concrete mix designs. Today, Mark is an entrepreneur, developer, and investor in various businesses.
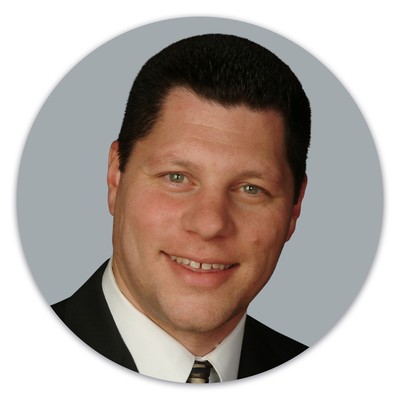
Mike is a Senior Vice President and Partner at Woodruff Sawyer in the Bay Area of California specializing in the development of D&O Liability programs for companies ranging from rapidly growing startups to Fortune 500 companies. With 20+ years of experience in Management Liability risk mitigation, Mike has negotiated all aspects of both public and private company D&O programs. Mike has experience in both public offerings and acquisitions at various stages. Mike is a member of AquiPor's Advisory Board.

With over 25 years of executive experience in commercial construction, Randy is the President of Partition Specialties, a leading interior construction company in the Bay Area and Southern California. Under Randy’s leadership, Partition Specialties has grown into a multi-million dollar company specializing in the distribution, installation, and service of architectural specialty products for all of California and parts of Nevada. Randy has a breadth of experience in accounting, finance, and contract administration. Randy is a member of our Board of Directors.
Names and titles as disclosed on StartEngine, SEC Form C. Bios and photos come from the platform campaign page and may be out of date.
Reg CF annual-report compliance
Filed 6 of 6 annual reports (FY2020–FY2025)
Reg CF issuers must file a Form C-AR each year until a Rule 202(b) termination trigger is met.
SEC filings
View all 37 filings on EDGAR- Form C/AJul 22, 20260001765489-26-000010EDGAR
- Form CMay 12, 20260001765489-26-000007EDGAR
- Form C-ARApr 7, 20260001765489-26-000003EDGAR
- Form C-UFeb 10, 20260001765489-26-000001EDGAR
- Form C/AOct 14, 20250001765489-25-000003EDGAR
- Form C/AJun 18, 20250001665160-25-001224EDGAR
- Form C/AApr 15, 20250001665160-25-000665EDGAR
- Form C-ARApr 9, 20250001665160-25-000541EDGAR
About this data. Figures are compiled from public sources — SEC EDGAR filings (Form C, C-AR, 1-A, 1-K) and funding-platform pages — and may be delayed, incomplete, or restated by the issuer. Financial statements are as reported by the issuer; each year is labeled with its assurance level (audited / reviewed / unaudited). A valuation cap is the conversion ceiling of a SAFE or convertible note, not an agreed company valuation; post-money figures are computed as pre-money plus amount raised and are not a traded price. Crowdonomics is not a broker-dealer, funding portal, or investment adviser; nothing here is investment advice or an offer to sell securities. Verify all figures against the linked EDGAR filings.