
Aurochs Brewing
Operating2121 Brewing Company LLC
Alcohol · Brewery · Emsworth, PA · Founded 2012
A new gluten free beer experience
Financials
FY2018–FY2024 · from SEC filings · hover any figure for its sourceFigures as reported by the issuer in the filing shown on hover. Each year’s pill shows the assurance level of its filed statements — audited, reviewed (CPA review, less than an audit), or unaudited, as the filing’s own report or certification states it. A dashed pill marked * is inferred instead: the SEC minimum for an offering that size, which the issuer may have exceeded. No pill means we couldn’t tell. Headcount is the filing’s point-in-time count, not a year-end average. Manually corrected figures are marked “Corrected”.
Valuation over rounds
Valuation caps on SAFE / convertible note roundsDashed amber bars are a SAFE or convertible note's valuation cap — the most it converts at, not what the company is worth.
Fundraising history
Team
5 people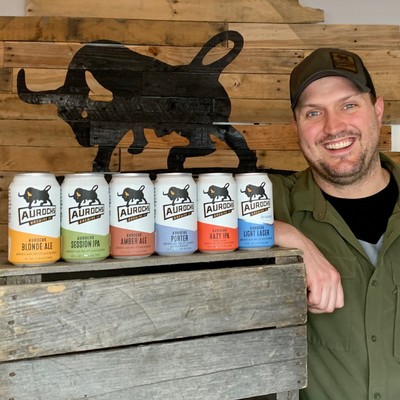
Doug is responsible for customer and consumer development at Aurochs Brewing Company. Prior to founding Aurochs Brewing Company, Doug managed sales accounts at Paychex and Acosta. At Paychex, Doug managed new client growth, customer service and the further development of 296 clients throughout 28 zip code sales territories. He increased sales by 41% over a six-month period. At Acosta, Doug managed accounts for six different consumer packaged goods companies throughout the Pittsburgh and Cleveland markets. Accounts combined for $5.3 million dollars in retail sales in 2009, and $5.5 million in 2010. He managed client sales relationship with Pinnacle Grocery for the Eastern Great Lakes region. Doug graduated from Penn State with a B.A. in Communications.
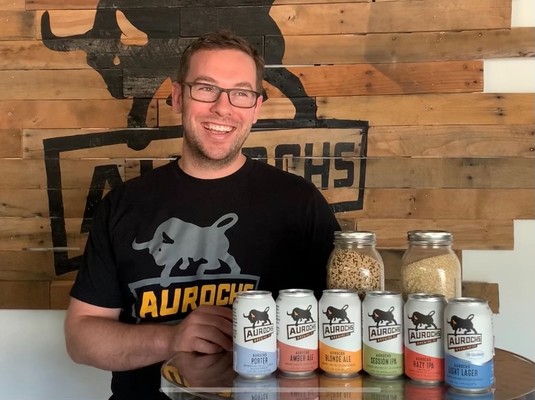
Ryan is responsible for strategy, finance, and operations at Aurochs Brewing Company. Prior to founding Aurochs Brewing Company, Ryan successfully managed a $2M global new product development project at MSA, a global safety products company. In this role, Ryan transformed a product line from concept to a market ready product line and established a supply chain with multiple manufacturing locations in North America, China, Japan, and Taiwan. Ryan received his M.B.A from the Tepper School of Business at Carnegie Mellon University and graduated cum laude from the University of Notre Dame with a B.S. in Mechanical Engineering.
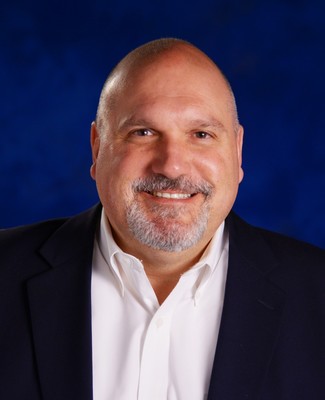
Brian Scott is the President and CEO of Pittmoss, a company that creates sustainable, organic soils made from recycled paper and cardboard. He was also founder and CEO of Express Management Group and an adjunct faculty member at Gannon University. Mr Scott began his career as the Chief Information Officer and Director of Acquisitions at Rentway, which went public on the NYSE during his tenure and exited with a sale in 2006. He has served on many for-profit and non-profit boards including Aurochs Brewing, The Flagship Niagara League, and the Innovation Collaborative and was the founder and chairman of Tall Ships Erie. Mr. Scott earned his undergraduate degree from the Pennsylvania State University and his master’s degree in software engineering from Gannon University. He has also been a business mentor with the Erie Technology Incubator and continues to mentor entrepreneurs as an angel investor with BlueTree Allied Angels, one of the most active angel groups in the Mid-Atlantic region of the US.

Ted has more than 25 years of experience in finance and venture capital, in addition to having served as an operating company executive in several venture-backed businesses. Most recently, Ted has been involved in managing a project with the Department of Defense centered around automated production technologies, prior to which he served as an executive in an innovative benefits insurance startup. As an institutional investor, Ted was a founding partner of Chart Venture Partners, a firm which focused on early stage technology companies with dual-use application (commercial plus defense/security/government markets). Prior to Chart, Ted worked in The Carlyle Group’s US venture capital investment arm, which emphasized multi-stage venture and growth equity investments across many sectors in the US. Before Carlyle, Ted was a partner at 4C Ventures, an early stage investment firm which was formerly the corporate venture arm of Olivetti. Ted has served as a Board Director or Observer for more than a dozen companies, in addition to several not-for-profit organizations. In addition to the operating roles mentioned above, Ted also worked as CFO of a materials technology company and an early stage biotech startup spun out of that materials business. Ted holds an MBA degree from Stanford University and BA in Economics from Williams College.
Names and titles as disclosed on SEC Form C, StartEngine. Bios and photos come from the platform campaign page and may be out of date.
Reg CF annual-report compliance
Filed 5 of 6 annual reports (FY2020–FY2025)
Reg CF issuers must file a Form C-AR each year until a Rule 202(b) termination trigger is met.
SEC filings
View all 20 filings on EDGAR- Form C-WDec 15, 20250001615727-25-000003EDGAR
- Form C-ARApr 28, 20250002063604-25-000005EDGAR
- Form C-ARApr 30, 20240001993016-24-000004EDGAR
- Form C-ARMay 1, 20230001615727-23-000001EDGAR
- Form C-UMay 11, 20220001665160-22-001624EDGAR
- Form C-ARMay 2, 20220001665160-22-001331EDGAR
- Form C/AApr 26, 20220001665160-22-000893EDGAR
- Form C/AMar 28, 20220001665160-22-000564EDGAR
About this data. Figures are compiled from public sources — SEC EDGAR filings (Form C, C-AR, 1-A, 1-K) and funding-platform pages — and may be delayed, incomplete, or restated by the issuer. Financial statements are as reported by the issuer; each year is labeled with its assurance level (audited / reviewed / unaudited). A valuation cap is the conversion ceiling of a SAFE or convertible note, not an agreed company valuation; post-money figures are computed as pre-money plus amount raised and are not a traded price. Crowdonomics is not a broker-dealer, funding portal, or investment adviser; nothing here is investment advice or an offer to sell securities. Verify all figures against the linked EDGAR filings.