

AvaWatz
OperatingAvaWatz Company
Software & AI · AI · Addison, TX · Founded 2019
A decision intelligence robotics network
Financials
FY2019–FY2025 · from SEC filings · hover any figure for its sourceFigures as reported by the issuer in the filing shown on hover. Each year’s pill shows the assurance level of its filed statements — audited, reviewed (CPA review, less than an audit), or unaudited, as the filing’s own report or certification states it. A dashed pill marked * is inferred instead: the SEC minimum for an offering that size, which the issuer may have exceeded. No pill means we couldn’t tell. Headcount is the filing’s point-in-time count, not a year-end average. Manually corrected figures are marked “Corrected”.
Valuation over rounds
Pre-money — the valuation set before each round’s money came inBlue bars are the pre-money valuation the company stated for a priced round.
Share price over rounds
Disclosed sales come from the issuer's own filings (prior-offering lines, audited-statement notes) and are amount ÷ securities sold. A down round is a firm point more than 25 % below the previous firm point of the same share class on a comparable basis; the comparison ignores unverified and year-only lines.
Fundraising history
Team
3 people
Bala Jana is the Co-Founder, Vice President, Treasurer, and Secretary at AvaWatz. Mr. Jana brings deep operational expertise in commercialization, product-market-fit, and production. He was an early team member leading product innovation at Navic Networks, acquired by Microsoft in 2008. He served as operational lead at Cartera Commerce, acquired by Rakuten Company in 2017. At Zipcar, he led the application group, acquired by AVIS BUDGET Group. Mr. Jana was a director and strategic advisor at mZeal/CyGlass (acquired by Nominet in 2020). Mr. Jana's primary occupation is with TCS. He works 40 hours per week for AvaWatz.
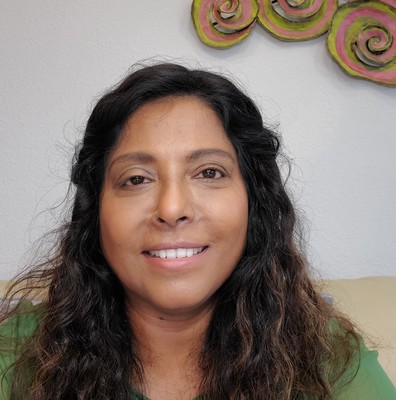
Rajini Anachi, Founder, CEO, and President of AvaWatz, is a serial entrepreneur and investor. She has successfully managed the development and go-to-market strategies of high-tech products and built successful businesses from ideation to M&A. Previously, Dr. Anachi founded mZeal/CyGlass, an AI-based cybersecurity company that was sold to Nominet, in 2020. She currently sits on the board of directors at Vitalsum. Dr. Anachi has the business and technology experience to lead AvaWatz commercialization to bring new innovative and cost-effective cooperative robotic solutions to disrupt the flightline operations, transit asset maintenance, and surveillance markets worldwide. She is focused on bringing tremendous value to AvaWatz customers, employees, and investors.

J.R. May is the Director of Business Development and Sales at AvaWatz. He has 25+ years of experience in DoD and commercial sales. He leads direct sales to the defense agencies and commercial markets. He is coordinating partnerships for R&D, Autonomy Squad, and Surveillance. Mr. May led business development and sales at mZeal/Cyglass (acquired by Nominet in 2020). He has an extensive network of connections and team-building skills to scale sales and business relations for AvaWatz growth.
Names and titles as disclosed on SEC Form C, StartEngine. Bios and photos come from the platform campaign page and may be out of date.
Reg CF annual-report compliance
Filed 5 of 5 annual reports (FY2021–FY2025)
Reg CF issuers must file a Form C-AR each year until a Rule 202(b) termination trigger is met.
SEC filings
View all 31 filings on EDGAR- Form C-ARMay 21, 20260001893890-26-000006EDGAR
- Form C/AApr 30, 20260001893890-26-000005EDGAR
- Form D/AAug 13, 20250001893890-25-000002EDGAR
- Form C/AApr 30, 20250001670254-25-000518EDGAR
- Form C-ARApr 23, 20250001893890-25-000001EDGAR
- Form C/AApr 7, 20250001670254-25-000300EDGAR
- Form CNov 18, 20240001670254-24-001092EDGAR
- Form C-UJul 26, 20240001665160-24-001104EDGAR
About this data. Figures are compiled from public sources — SEC EDGAR filings (Form C, C-AR, 1-A, 1-K) and funding-platform pages — and may be delayed, incomplete, or restated by the issuer. Financial statements are as reported by the issuer; each year is labeled with its assurance level (audited / reviewed / unaudited). A valuation cap is the conversion ceiling of a SAFE or convertible note, not an agreed company valuation; post-money figures are computed as pre-money plus amount raised and are not a traded price. Crowdonomics is not a broker-dealer, funding portal, or investment adviser; nothing here is investment advice or an offer to sell securities. Verify all figures against the linked EDGAR filings.