

Beanstox
OperatingBeanstox Inc.
Fintech · Fintech · Boston, MA · Founded 2018
Cofounded by Shark Tank investor, Kevin O’Leary, Beanstox is an app designed to help millions of Americans begin saving and investing to build their wealth.
Financials
FY2018–FY2025 · from SEC filings · hover any figure for its sourceFigures as reported by the issuer in the filing shown on hover. Each year’s pill shows the assurance level of its filed statements — audited, reviewed (CPA review, less than an audit), or unaudited, as the filing’s own report or certification states it. A dashed pill marked * is inferred instead: the SEC minimum for an offering that size, which the issuer may have exceeded. No pill means we couldn’t tell. Headcount is the filing’s point-in-time count, not a year-end average. Manually corrected figures are marked “Corrected”.
Valuation over rounds
Pre-money — the valuation set before each round’s money came inBlue bars are the pre-money valuation the company stated for a priced round.
Share price over rounds
“Today's shares” restates every price in the share terms current now, so a price before a split or an LLC→corporation conversion is divided by that event's ratio (each event is cited on the round page). Disclosed sales come from the issuer's own filings (prior-offering lines, audited-statement notes) and are amount ÷ securities sold. A down round is a firm point more than 25 % below the previous firm point of the same share class on a comparable basis; the comparison ignores unverified and year-only lines.
Cap table
Share counts as of Dec 31, 2025| Class | Outstanding | Votes / share | Share of total | Last price |
|---|---|---|---|---|
| Common stock | 20,000,000 | — | 100.0% | $1.25Jul 2021 |
Shares outstanding over timein today's share terms
Principal holders% as the filing states it, Apr 28, 2026
- Beanstox Investments Inc.20,000,000 Class A Voting Common Stock100.0%of Class A Voting
Sold to the crowd
- Reg CF · Jul 2020273,628,800,000 shares at $0.00 in today's terms · sold as 1,368,144 shares at $0.75; since then a 200000-for-1 split (Dec 2020)$1M· 2,810 investors
- Reg CF · Jul 20211,838,982 shares at $1.25$2.3M· 2,833 investors
From the company's SEC filings: share counts per class, each class's voting and conversion terms, and the holders of 20% or more that Form C requires (officers and 10%+ holders on Form 1-A). Filings name only large holders, so most owners — including crowd investors — are not listed, and a holder's percentage may be of its own class rather than of the whole company. Prices and crowd share counts are in today's share terms — adjusted for splits and conversions since they were sold. Hover a figure for its filing.
Fundraising history
Team
3 people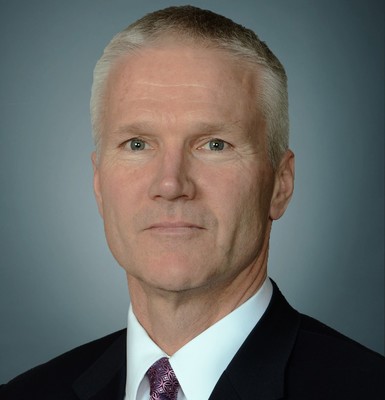
Connor leads the development, team building and management of the company. Mr. O’Brien has over 30 years of experience in financial services, including 15 years in New York, at Lehman Brothers and Merrill Lynch, followed by investment management in leading a mutual fund business and then leading the successful development and growth of O’Shares ETFs with ETFs listed on the New York Stock Exchange. He has led Beanstox through product development and successful release in the AppStores. He is a graduate of Dartmouth College (MBA) and Middlebury College (BA in Physics and Economics).

Louise Anne oversees administration, compliance and operations at Beanstox. She is an attorney with over 30 years of legal and investment management experience, initially in New York handling corporate securities and investment fund related matters at the Wall Street law firm of Schulte, Roth and Zabel and subsequently at Stanton Asset Management and O’Leary Funds in Montreal. Ms. Poirier is also the Treasurer and CCO at O’Shares ETFs. Ms. Poirier is a graduate of the University of Montréal (LL.B.) and Columbia University (Masters International and Public Affairs).
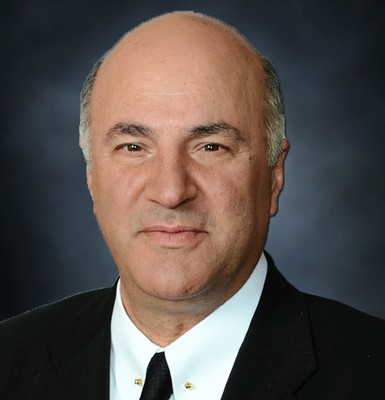
Kevin is actively involved in Beanstox, particularly regarding investor experience, strategy and marketing. Mr. O`Leary, aka Mr. Wonderful on Shark Tank, is a well-known investor, entrepreneur and business builder. He has a social media following of over 3 million people and has experience with digital marketing strategies for various consumer businesses. He is passionate about helping people with financial literacy and building their financial future. He is the bestselling author of three books on personal finance, money and investing: Cold Hard Truth and Men, Women and Money, and Cold Hard Truth on Family, Kids and Money. Kevin O’Leary is a strategic advisor and paid spokesperson for StartEngine, which owns the funding portal hosting the Offering.
Names and titles as disclosed on SEC Form C, StartEngine. Bios and photos come from the platform campaign page and may be out of date.
Reg CF annual-report compliance
Filed 6 of 6 annual reports (FY2020–FY2025)
Reg CF issuers must file a Form C-AR each year until a Rule 202(b) termination trigger is met.
SEC filings
View all 16 filings on EDGAR- Form C-ARApr 28, 20260001812658-26-000004EDGAR
- Form C-ARApr 18, 20250001665160-25-000715EDGAR
- Form C-ARApr 24, 20240001665160-24-000471EDGAR
- Form C-ARApr 27, 20230001665160-23-000887EDGAR
- Form C-UApr 29, 20220001665160-22-001233EDGAR
- Form C-ARApr 28, 20220001665160-22-001127EDGAR
- Form C/AApr 14, 20220001665160-22-000651EDGAR
- Form C/AFeb 22, 20220001665160-22-000314EDGAR
About this data. Figures are compiled from public sources — SEC EDGAR filings (Form C, C-AR, 1-A, 1-K) and funding-platform pages — and may be delayed, incomplete, or restated by the issuer. Financial statements are as reported by the issuer; each year is labeled with its assurance level (audited / reviewed / unaudited). A valuation cap is the conversion ceiling of a SAFE or convertible note, not an agreed company valuation; post-money figures are computed as pre-money plus amount raised and are not a traded price. Crowdonomics is not a broker-dealer, funding portal, or investment adviser; nothing here is investment advice or an offer to sell securities. Verify all figures against the linked EDGAR filings.