

XiQ
OperatingElectroniXiQ, Inc.
Software & AI · Avondale Estates, GA
Financials
FY2015–FY2020 · from SEC filings · hover any figure for its sourceFigures as reported by the issuer in the filing shown on hover. Each year’s pill shows the assurance level of its filed statements — audited, reviewed (CPA review, less than an audit), or unaudited, as the filing’s own report or certification states it. A dashed pill marked * is inferred instead: the SEC minimum for an offering that size, which the issuer may have exceeded. No pill means we couldn’t tell. Headcount is the filing’s point-in-time count, not a year-end average. Manually corrected figures are marked “Corrected”.
Valuation over rounds
Pre-money — the valuation set before each round’s money came inBlue bars are the pre-money valuation the company stated for a priced round.
Fundraising history
Team
5 people
10+ years in low voltage/current electronics engineering and design. CTO of XiQ-April 2015 to present. Florian is the original XiQ member. He invented the very first prototype now known as the Stinger. He started in the summer of 2014 with his idea. The company was started with Karlos Walkes in April of 2015 and Florian has been working for the company since then.

20+ years in media/entertainment. 7+ years in startup development. CEO of XiQ-April 2015 to present. Karlos has been a media/entertainment professional with experience that spans over 20 years. He has been involved in many industrial, commercial, television and film projects. His years in this industry has built complementary skills in communications and on camera/voice-over expertise. Karlos founded on-line cultural exchange platform, know as Flagstamp.com, in July 2011. It is a venture that creates, develops and initiates efficient tools that promote intercultural exchange, communication and education. He was the Founder/President of the non-profit Flagshare, Inc. from July 2011 to May 2015. This program provides running shoes to underserved youth so they may challenge childhood inactivity with an active and healthy lifestyle. Of course from April 2015 to the present he's CEO of XiQ.

20+ years of professional financial experience in global media/entertainment markets. CFO of XiQ- December 2015 to present. Steven Hickson is an experienced CFO with start-up and growth-stage companies. He has been CFO for a global pay television venture, LAPTV that was acquired by 20th Century FOX. From January 2015 to December 2015 he was acting CFO for "Intellimedix" a promising early-stage genomics profiliing company. From February 2016 to the present he has been the CFO of "AccuWeather," a global weather forecasting and media company. He is also a successful angel investor and strong supporter of the venture community. He has served as CFO for XiQ from December 2015 to present.
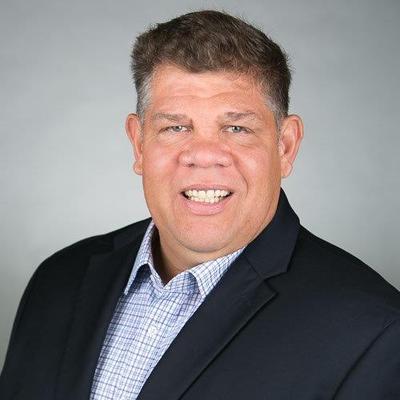
International consumer packaged goods sales and marketing executive with 20+ years experience. U.S. Army Veteran. VP/Sales of XiQ-July 2017 to present. Phil Taylor's extensive background includes State Government Tamaulipas Assistant Director from 1990 to 1995, Foreign Trade Bank of Mexico as Trade Commissioner from1996 to 1997, Altama the Military Department of Defense Contractor as International Sales Manager from 1997 to 1999. He was also CPG VP of Sales and Marketing for Hafner from 2003 to 2005, and CPG Director of Sales, from 2008 to 2013 & Regional Sales Manage from 2006 to 2008 for V&V Supremo. Most recently he's been CPG VP of Sales and Marketing from 2013 to 2014 for Compañía Nacional de Chocolate, an international premium chocolate distributor. Currently he's a consultant with Market Pathfinder since 2014. Market Pathfiner develops marketing and sales strategy for small to mid-level companies. He has served as VP of Sales for XiQ from July 2017 to present.

30+ years engineering experience, software development and product development. VP/Engineering of XiQ-June 2016 to present. Stephen Vick has over 30 years of experience designing electronics and software for dozens of different companies in the US. He has extensive knowledge of both microprocessor based systems and wireless communication, both Bluetooth and LoraWan. From January of 2015 to January of 2018 he has been self employed as a consultant in electronics design through his contracting company, Prime Audio Inc. He has served as VP of Engineering with XiQ from June 2016 to present.
Names and titles as disclosed on StartEngine, SEC Form C. Bios and photos come from the platform campaign page and may be out of date.
Reg CF annual-report compliance
Filed 3 of 9 annual reports (FY2017–FY2025)
Reg CF issuers must file a Form C-AR each year until a Rule 202(b) termination trigger is met.
SEC filings
- Form C-TRJun 14, 20240001665160-24-000985EDGAR
- Form C-AR/ADec 27, 20210001665160-21-002326EDGAR
- Form C-ARApr 28, 20210001665160-21-000644EDGAR
- Form C-ARApr 20, 20200001665160-20-000338EDGAR
- Form C-ARApr 30, 20190001665160-19-000513EDGAR
- Form C-UJun 12, 20180001665160-18-000563EDGAR
- Form CMar 12, 20180001665160-18-000185EDGAR
About this data. Figures are compiled from public sources — SEC EDGAR filings (Form C, C-AR, 1-A, 1-K) and funding-platform pages — and may be delayed, incomplete, or restated by the issuer. Financial statements are as reported by the issuer; each year is labeled with its assurance level (audited / reviewed / unaudited). A valuation cap is the conversion ceiling of a SAFE or convertible note, not an agreed company valuation; post-money figures are computed as pre-money plus amount raised and are not a traded price. Crowdonomics is not a broker-dealer, funding portal, or investment adviser; nothing here is investment advice or an offer to sell securities. Verify all figures against the linked EDGAR filings.