

Enervolt
OperatingEnvervolt
Software & AI · Ashland, NV · Founded 2012
Energy solutions for the vital problems
Financials
FY2015–FY2020 · from SEC filings · hover any figure for its sourceFigures as reported by the issuer in the filing shown on hover. Each year’s pill shows the assurance level of its filed statements — audited, reviewed (CPA review, less than an audit), or unaudited, as the filing’s own report or certification states it. A dashed pill marked * is inferred instead: the SEC minimum for an offering that size, which the issuer may have exceeded. No pill means we couldn’t tell. Headcount is the filing’s point-in-time count, not a year-end average. Manually corrected figures are marked “Corrected”.
Valuation over rounds
Pre-money — the valuation set before each round’s money came inBlue bars are the pre-money valuation the company stated for a priced round.
Share price over rounds
Disclosed sales come from the issuer's own filings (prior-offering lines, audited-statement notes) and are amount ÷ securities sold. A down round is a firm point more than 25 % below the previous firm point of the same share class on a comparable basis; the comparison ignores unverified and year-only lines.
Fundraising history
Team
11 people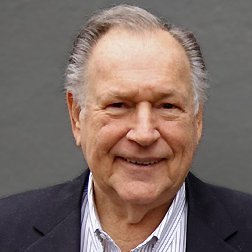
Over a career that spans four decades, Bill has served as President and CEO of four privately held companies, which he later took public on NASDAQ: Future Communities, a building conglomerate, Growth Sciences, a scientific and research development company, Patco Industries, a law enforcement products company, and Applied Laser Systems. Bill was directly responsible for raising over $30,000,000 for Applied Laser Systems. Since 2014 Bill has been the President and CEO of Apparent Energy. He is also President & CEO of Hedgebrook Inc., a shell company, from 2012 - Present
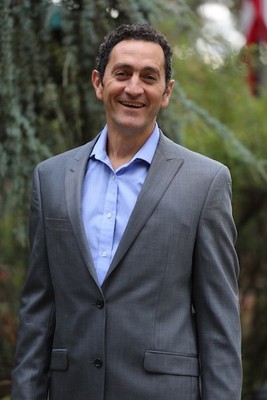
Hani Hajje is an engineer and serial entrepreneur. Hani started his first e-commerce software company Power Solutions, Inc. in 1995 and had a success exit. Hani later joined a payment processing company Merchant e-Solutions and was on the executive team till they sold in 2012. Hani is a co-founder of Apparent Energy and has been a board member of the company since 2012.

Nick Baida is the owner of 7 businesses. Since Nick became an Officer Company in August 2017, the Company has moved forward in a positive note by creating structure and teamwork to achieve our goals. Nick is also one of the creators behind our patents. Nick has been the CEO and owner of Sunshine Large Load Laundry since 2007 - Present, and NBC Incorporated, a company that buys and sells houses, for profit, since 1998 - Present.
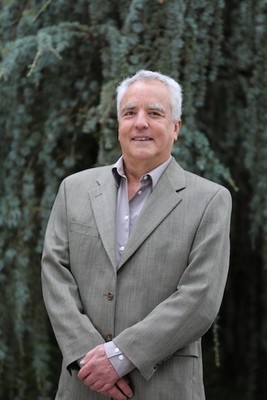
Adam was with Bill going back to their success with making the laser pointer and other patented technologies. They have spent their lives inventing and building companies with complimentary skills.

Clay is one of the main brains behind the DEC patented technology. He is a excellent engineer with experience over education and has been with the Company since 2015.

Gerard has decades of experience in digital printing, engineering, and the CAD. Gerard like many of those on the team are looking at Apparent Energy as the future of renewable energy's.

Holly has been working for Bill in various endeavors for over a decade and is a perfectionist with great attention to detail.
Brett helped found the company and is now working on his own projects and businesses.
Show 2 more peopleShow fewer


William Go started as an engineer with Cisco Systems. Since that time he has worked in the investment world managing investments. Since 2014 William Go has been a managing partner of Johnny Carino's restaurant chain. William Go has been a board member of Apparent Energy since 2017.
Names and titles as disclosed on StartEngine, SEC Form C. Bios and photos come from the platform campaign page and may be out of date.
Reg CF annual-report compliance
Filed 3 of 9 annual reports (FY2017–FY2025)
Reg CF issuers must file a Form C-AR each year until a Rule 202(b) termination trigger is met.
SEC filings
- Form C-UMay 13, 20220001665160-22-001651EDGAR
- Form CNov 23, 20210001665160-21-002086EDGAR
- Form C-ARSep 21, 20200001665160-20-001167EDGAR
- Form C-ARSep 21, 20200001665160-20-001168EDGAR
- Form C-ARSep 21, 20200001665160-20-001169EDGAR
- Form C-UMay 8, 20180001665160-18-000430EDGAR
- Form CMar 22, 20180001665160-18-000232EDGAR
- Form DAug 16, 20170001250853-17-000074EDGAR
About this data. Figures are compiled from public sources — SEC EDGAR filings (Form C, C-AR, 1-A, 1-K) and funding-platform pages — and may be delayed, incomplete, or restated by the issuer. Financial statements are as reported by the issuer; each year is labeled with its assurance level (audited / reviewed / unaudited). A valuation cap is the conversion ceiling of a SAFE or convertible note, not an agreed company valuation; post-money figures are computed as pre-money plus amount raised and are not a traded price. Crowdonomics is not a broker-dealer, funding portal, or investment adviser; nothing here is investment advice or an offer to sell securities. Verify all figures against the linked EDGAR filings.