
FIRE DEPARTMENT COFFEE
OperatingFire Department Coffee, Inc.
Food & Beverage · Packaged Drink · Rockford, IL · Founded 2016
Handcrafted, super-premium coffee
Financials
FY2021–FY2025 · from SEC filings · hover any figure for its sourceFigures as reported by the issuer in the filing shown on hover. Each year’s pill shows the assurance level of its filed statements — audited, reviewed (CPA review, less than an audit), or unaudited, as the filing’s own report or certification states it. A dashed pill marked * is inferred instead: the SEC minimum for an offering that size, which the issuer may have exceeded. No pill means we couldn’t tell. Headcount is the filing’s point-in-time count, not a year-end average. Manually corrected figures are marked “Corrected”.
Valuation over rounds
Pre-money — the valuation set before each round’s money came inBlue bars are the pre-money valuation the company stated for a priced round.
Share price over rounds
Disclosed sales come from the issuer's own filings (prior-offering lines, audited-statement notes) and are amount ÷ securities sold. A down round is a firm point more than 25 % below the previous firm point of the same share class on a comparable basis; the comparison ignores unverified and year-only lines.
Cap table
Share counts as of Aug 25, 2026| Class | Outstanding | Votes / share | Share of total | Votes | Last price |
|---|---|---|---|---|---|
| Preferred Stockpreferred | 238,095 | 1 | 3.57% | 100.0% | — |
| Voting Common Stock | 6,426,189 | none | 96.4% | 0% | $252.53Aug 2020 |
| Total | 6,664,284 | 100% | 100% |
Shares outstanding over timein today's share terms
Principal holders% as the filing states it, Aug 25, 2026
- Luke Joseph Schneider3,700,785 Voting Common Stock55.5%of Voting
Sold to the crowd
- Reg CF · Jun 2023157,670 shares at $8.40$1.3M· 1,429 investors
- Reg CF · Jun 202553,939 Non-Voting Common Stock at $10.87$586.3K· 488 investors
From the company's SEC filings: share counts per class, each class's voting and conversion terms, and the holders of 20% or more that Form C requires (officers and 10%+ holders on Form 1-A). Filings name only large holders, so most owners — including crowd investors — are not listed, and a holder's percentage may be of its own class rather than of the whole company. Prices and crowd share counts are in today's share terms — adjusted for splits and conversions since they were sold. Hover a figure for its filing.
Fundraising history
Team
7 people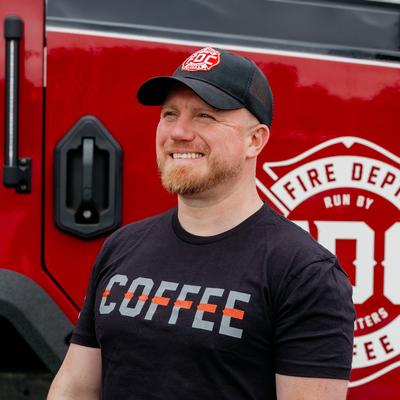
Luke Schneider is the founder and CEO of Fire Department Coffee based in Rockford, IL. He’s a U.S. Navy veteran that served amid our nation’s wars in Iraq and Afghanistan. After leaving the Navy in 2008, he became a professional firefighter for the city of Rockford. In addition to his passion for serving his country and his community, he also found a passion for crafting great-tasting coffee and started Fire Department Coffee in 2016.

Brad Flaherty is the Chief Creative Officer for Fire Department Coffee. He leads the company's branding and marketing with a focus on successfully growing the company’s digital presence. Brad has a background in graphic design and he’s been creating professionally since 2001 where he’s worked for both in-house studios and design agencies over his career. Most notably he’s worked with brands like the NFL’s Washington Football Team, Hilton Hotels, Wilson Sporting Goods, MillerCoors, Conair and UFC — designing the Legacy Belt for all UFC champions.
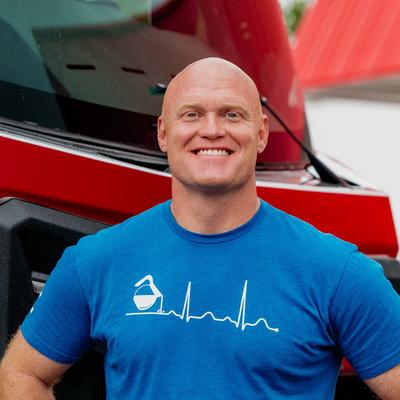
Jason Patton is the Senior Vice President and co-owner of Fire Department Coffee. Jason is also a 17 year Driver Engineer/Paramedic for a South Florida fire department. Jason has been responsible for the growth of Fire Department Coffee's video presence on Social Media and TV commercials. These responsibilities include, but not limited to, writing, producing, directing, editing and starring in videos. Jason has helped grow the social following of Fire Department Coffee and Fire Department Chronicles to a combined 5.5 million followers through fun, engaging and emotionally capturing videos.

Jeff is the acting Chief Financial Officer at Fire Department Coffee and Professor Emeritus of Business at Rockford University. Jeff works with and supports the FDC Leadership Team to develop and execute strategic direction and goals. He also helps with analysis and decision-making related to financial operations. While at Rockford University Jeff was Assistant Professor and the MBA Director. In this role he was also responsible for Executive Development Training and the Graduate Assistant program. Jeff has been recognized for his contributions to the Rockford Community, such as being named 2014 Citizen of the Year and 21 People You Should Know in Rockford in 2011 by the Rockford Area Chamber of Commerce.
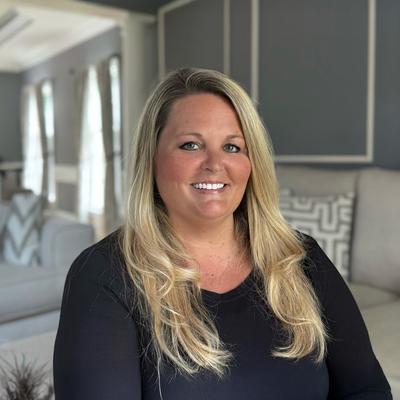
Stacey Helbig is the Chief Operating Officer of Fire Department Coffee. She leads the company's day-to-day operations and strategic growth initiatives with a focus on driving operational excellence across the organization. Previously serving as VP of Wholesale over the last year, Stacey has been instrumental in expanding FDC's market presence and developing key business relationships. Prior to joining Fire Department Coffee, she held executive positions at Staples over the last 13 years ranging from Sr. Merchant, Vice President of Strategy and Vice President/General Merchandise Manager. In these roles, she led high-impact transformation projects that delivered significant EBITDA growth and increased customer traffic to Staples retail stores. With a vast background in business development and a Bachelor of Science in Marketing, Stacey brings valuable expertise in innovation, strategic planning, and customer-centric solutions to the leadership team.
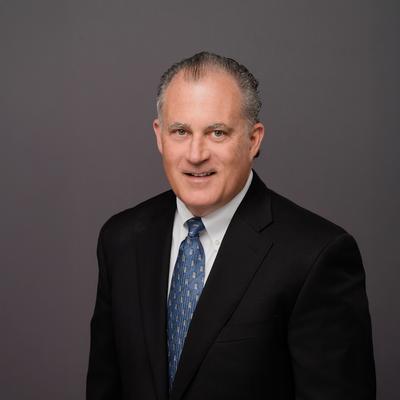
With 40 years of experience in the consumer packaged goods industry and private equity, Don currently serves on the boards of Slawek Family Investments, House of Spice, Devansoy, and Fire Dept Coffee. He is a Managing Director at Akoya Capital, focusing on the firm’s consumer packaged goods, ingredients, and health and wellness businesses.
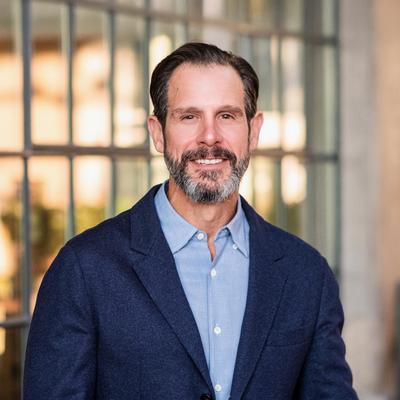
Peter Provenzano is the President & CEO of SupplyCore Inc., a supply chain integrator and government contractor. An advocate for innovation, Peter has helped shape the federal defense contracting industry. After years of leading SupplyCore to refine its technology, procurement and logistic capabilities, Peter transitioned the company in the 2000s from a transactional store and forward model to a programmatic, direct-to-the-customer supply chain integrator. This innovative approach, supplying mission critical materials directly to military bases and end users, has aided both the U.S. and foreign military services in supporting sustainment and maintaining readiness.
Names and titles as disclosed on SEC Form C, StartEngine. Bios and photos come from the platform campaign page and may be out of date.
Reg CF annual-report compliance
Filed 3 of 3 annual reports (FY2023–FY2025)
Reg CF issuers must file a Form C-AR each year until a Rule 202(b) termination trigger is met.
SEC filings
View all 9 filings on EDGAR- Form C-ARAug 25, 20260001978166-26-000004EDGAR
- Form DFeb 25, 20260001978166-26-000001EDGAR
- Form CJun 26, 20250001665160-25-001241EDGAR
- Form C-ARJun 20, 20250001665160-25-001228EDGAR
- Form C-ARMay 13, 20240001665160-24-000835EDGAR
- Form C-UNov 8, 20230001665160-23-001910EDGAR
- Form C/ASep 1, 20230001665160-23-001714EDGAR
- Form C/AJul 11, 20230001665160-23-001500EDGAR
About this data. Figures are compiled from public sources — SEC EDGAR filings (Form C, C-AR, 1-A, 1-K) and funding-platform pages — and may be delayed, incomplete, or restated by the issuer. Financial statements are as reported by the issuer; each year is labeled with its assurance level (audited / reviewed / unaudited). A valuation cap is the conversion ceiling of a SAFE or convertible note, not an agreed company valuation; post-money figures are computed as pre-money plus amount raised and are not a traded price. Crowdonomics is not a broker-dealer, funding portal, or investment adviser; nothing here is investment advice or an offer to sell securities. Verify all figures against the linked EDGAR filings.