

FISHER WALLACE LABORATORIES
Raising nowOperatingFisher Wallace Laboratories, Inc.
Healthcare · Brooklyn, NY · Founded 2019
Medical Devices for Mood and Sleep
This company has an open fundraising round.
Financials
FY2017–FY2025 · from SEC filings · hover any figure for its sourceChart shows the most recent 8 fiscal years; 1 earlier year is in the table below.
Figures as reported by the issuer in the filing shown on hover. Each year’s pill shows the assurance level of its filed statements — audited, reviewed (CPA review, less than an audit), or unaudited, as the filing’s own report or certification states it. A dashed pill marked * is inferred instead: the SEC minimum for an offering that size, which the issuer may have exceeded. No pill means we couldn’t tell. Headcount is the filing’s point-in-time count, not a year-end average. Manually corrected figures are marked “Corrected”.
Valuation over rounds
Pre-money — the valuation set before each round’s money came inBlue bars are the pre-money valuation the company stated for a priced round. Dotted grey bars are our estimate for rounds that didn't state one: the round's share price × the shares outstanding in its filings. Same measure as blue, but rougher.
Share price over rounds
Disclosed sales come from the issuer's own filings (prior-offering lines, audited-statement notes) and are amount ÷ securities sold. A down round is a firm point more than 25 % below the previous firm point of the same share class on a comparable basis; the comparison ignores unverified and year-only lines, and each class is drawn as its own line.
Cap table
Share counts as of Dec 31, 2025These classes don't convert into each other and last sold at very different prices, so their share counts can't be added up into ownership percentages. Compare them by price instead.
| Class | Outstanding | Votes / share | Votes | Liquidation | Last price |
|---|---|---|---|---|---|
| Series Seed Preferred Stockpreferred | 933,727 | — | 10.6% | 1× non-participating · paid 1st | $2.74Dec 2021 |
| common stock(as of Dec 31, 2024) | 1,940,430 | — | 21.9% | paid 2nd | — |
| Class A Common Stock(as of Dec 31, 2024) | 5,971,315 | — | 67.5% | — | $0.0001Sep 2019 |
| Class B Shares(as of Dec 31, 2024) | 1,940,430 | none | 0% | — | $11.38Oct 2026 |
Principal holders% as the filing states it, Apr 30, 2026
- Charles A. Fisher3,722,193 Class A Shares53.3%of Class A
Sold to the crowd
- Reg CF · Oct 2019428,000 shares at $2.50$1.1M· 1,479 investors
- Reg A+ · May 2020751,146 shares at $6.21$4.7M· 2,776 investors
- Reg CF · Mar 202295,595 shares at $8.76$837.4K· 702 investors
- Reg CF · Aug 202220,601 shares at $8.81$181.5K· 273 investors
- Reg CF · Sep 2022100,317 shares at $8.81$883.8K· 621 investors
- Reg A+ · Jan 202344,543 shares at $10.67$475.3K· 474 investors
- Reg CF · Mar 2023$11.7K
- Reg CF · Nov 202348,799 shares at $10.99$536.3K
- Reg CF · Jan 202442,373 shares at $11.07$469.1K
- Reg CF · Mar 202436,535 shares at $11.11$405.9K
- Reg CF · Jun 202421,094 shares at $11.27$237.7K
- Reg CF · Sep 202424,890 shares at $11.30$281.3K
- Reg CF · Dec 202419,875 shares at $10.94$217.4K· 222 investors
- Reg CF · Feb 2025$203.3K· 133 investors
- Reg CF · Oct 202520,829 shares at $10.96$228.3K· 218 investors
- Reg CF · Nov 202517,467 shares at $11.19$195.5K· 158 investors
- Reg CF · Jan 202611,608 shares at $11.21$130.1K
- Reg CF · Apr 202640,565 shares at $11.30$458.4K
From the company's SEC filings: share counts per class, each class's voting and conversion terms, and the holders of 20% or more that Form C requires (officers and 10%+ holders on Form 1-A). Filings name only large holders, so most owners — including crowd investors — are not listed, and a holder's percentage may be of its own class rather than of the whole company. Prices and crowd share counts are in today's share terms — adjusted for splits and conversions since they were sold. Hover a figure for its filing.
Fundraising history
Team
3 people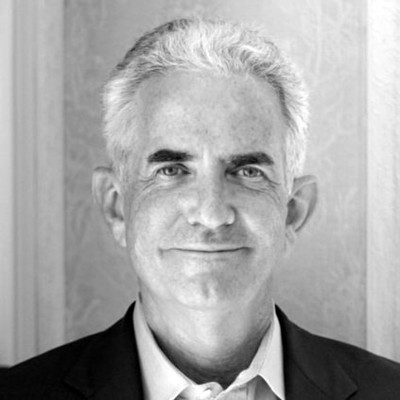
Charles “Chip” Fisher grew up in the electronics business - his father, Avery Fisher, founded Fisher Radio (later renamed Fisher Electronics). After graduating from Harvard and serving as a sales executive at IBM, Chip acquired the original intellectual property to the Fisher Wallace Stimulator and is the company’s CFO and largest shareholder - and a recent TEDx contributor.
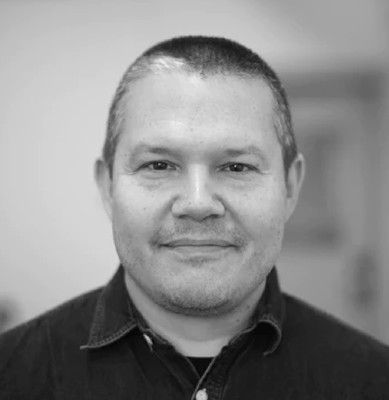
For more than a decade, Kelly Roman has helped pioneer the prescription wearable category and has expertise in product development, regulatory affairs, healthcare marketing and clinical trial strategy. Prior to co-founding Fisher Wallace, Kelly graduated from Harvard and served as an award-winning executive in the digital advertising and SaaS industries. He recently served on the boards of two charter high schools in New York City.

Simon is CEO of SHUFL Capital, the venture capital firm that recently invested in Fisher Wallace Laboratories. Simon's early career was spent in the UK financial services sector leading business change, delivering technology transformations and supporting M&A transactions. He led CPA Global on its 20 year journey from a £50m business to its recent public market entry at a value of £6.5bn. Simon has been investing in and working with founders of growth businesses in the SHUFL sectors since 2010.
Names and titles as disclosed on SEC Form 1-A, StartEngine, SEC Form C. Bios and photos come from the platform campaign page and may be out of date.
Reg CF annual-report compliance
Filed 7 of 7 annual reports (FY2019–FY2025)
Reg CF issuers must file a Form C-AR each year until a Rule 202(b) termination trigger is met.
SEC filings
View all 93 filings on EDGAR- Form COct 7, 20260001787792-26-000016EDGAR
- Form C-UOct 6, 20260001787792-26-000015EDGAR
- Form 1-SASep 28, 20260001787792-26-000014EDGAR
- Form C-USep 21, 20260001787792-26-000013EDGAR
- Form C/AJul 16, 20260001787792-26-000011EDGAR
- Form C/AMay 22, 20260001787792-26-000009EDGAR
- Form C-ARApr 30, 20260001787792-26-000006EDGAR
- Form C-AR/AApr 30, 20260001787792-26-000007EDGAR
About this data. Figures are compiled from public sources — SEC EDGAR filings (Form C, C-AR, 1-A, 1-K) and funding-platform pages — and may be delayed, incomplete, or restated by the issuer. Financial statements are as reported by the issuer; each year is labeled with its assurance level (audited / reviewed / unaudited). A valuation cap is the conversion ceiling of a SAFE or convertible note, not an agreed company valuation; post-money figures are computed as pre-money plus amount raised and are not a traded price. Crowdonomics is not a broker-dealer, funding portal, or investment adviser; nothing here is investment advice or an offer to sell securities. Verify all figures against the linked EDGAR filings.