

Geoship
OperatingGeoship SPC
Biotech · Nevada City, WA · Founded 2014
Invest in a Homebuilding Revolution
Financials
FY2017–FY2025 · from SEC filings · hover any figure for its sourceChart shows the most recent 8 fiscal years; 1 earlier year is in the table below.
Figures as reported by the issuer in the filing shown on hover. Each year’s pill shows the assurance level of its filed statements — audited, reviewed (CPA review, less than an audit), or unaudited, as the filing’s own report or certification states it. A dashed pill marked * is inferred instead: the SEC minimum for an offering that size, which the issuer may have exceeded. No pill means we couldn’t tell. Headcount is the filing’s point-in-time count, not a year-end average. Manually corrected figures are marked “Corrected”.
Valuation over rounds
Pre-money — the valuation set before each round’s money came inBlue bars are the pre-money valuation the company stated for a priced round. Dotted grey bars are our estimate for rounds that didn't state one: the round's share price × the shares outstanding in its filings. Same measure as blue, but rougher. Dashed amber bars are a SAFE or convertible note's valuation cap — the most it converts at, not what the company is worth, so don't compare them with the other bars.
Share price over rounds
“Today's shares” restates every price in the share terms current now, so a price before a split or an LLC→corporation conversion is divided by that event's ratio (each event is cited on the round page). Disclosed sales come from the issuer's own filings (prior-offering lines, audited-statement notes) and are amount ÷ securities sold. A down round is a firm point more than 25 % below the previous firm point of the same share class on a comparable basis; the comparison ignores unverified and year-only lines.
Cap table
Share counts as of Dec 31, 2024| Class | Outstanding | Votes / share | Share of total | Last price |
|---|---|---|---|---|
| Common Stock | 11,956,143 | 1 | 100.0% | $0.3629Dec 2021 |
Shares outstanding over timein today's share terms
Principal holders% as the filing states it, May 21, 2026
- Morgan Bierschenk57,166,669 Common Stock63.1%of votes
Sold to the crowd
- Reg CF · Jan 202013,868,491 shares at $0.0771 in today's terms · sold as 1,981,213 shares at $0.54; since then a 7-for-1 split (Dec 2025)$1.1M· 1,807 investors
- Reg CF · Dec 20211,365,385 shares at $0.3629 in today's terms · sold as 195,055 shares at $2.54; since then a 7-for-1 split (Dec 2025)$495.4K· 446 investors
- Reg CF · Feb 2023Crowd SAFE$407.2K· 628 investors
- Reg CF · Oct 2024$3.5M· 945 investors
- Reg CF · May 2025$1.2M
- Reg CF · Jan 2026$1.4M
From the company's SEC filings: share counts per class, each class's voting and conversion terms, and the holders of 20% or more that Form C requires (officers and 10%+ holders on Form 1-A). Filings name only large holders, so most owners — including crowd investors — are not listed, and a holder's percentage may be of its own class rather than of the whole company. Prices and crowd share counts are in today's share terms — adjusted for splits and conversions since they were sold. Hover a figure for its filing.
Fundraising history
Team
21 people
Adam brings two decades of industry experience in CNC mold making, prototype development, and novel manufacturing to Geoship. Before Geoship he pioneered CNC mold making technologies in the R&D lab of one of the world's top kayak companies.

Bas' passion and experience are rooted in human-centered design. Through his independent practice in design for public space, education, and products he likes to say — “Design is about redefining the ways we relate to each other, our objects and the world around us".

Jared brings to Geoship a kaleidoscope of experience in radio and documentary journalism, international book trade, herbal medicine, cooking, bicycle mechanics, traditional Benin dance, and woodworking. Now he applies his passion for beauty and ecological thinking to building regenerative geodesic homes and villages.

Jay’s focus is on aligning purpose and action, with more than a quarter of his life centered around cultivating and contributing to productive, efficient purpose driven teams all over the world.
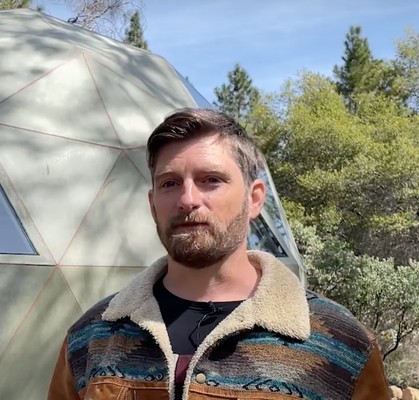
Morgan brings vision, broad technical understanding, entrepreneurial grit, and years of engineering and program management experience to Geoship. Prior to Geoship, Morgan spent 7 years in various engineering roles at Intel Corporation, followed by 8 years of vagabonding and sailing around the world.
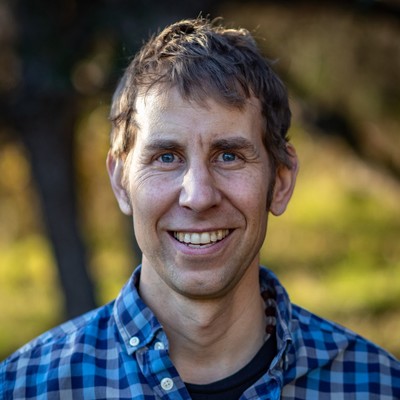
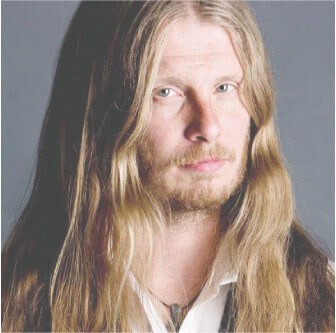
Ásgeir is an Icelandic Native, community visionary, social entrepreneur, and permaculture specialist. Geoship plans to expand soon to Iceland, and Asgeir is laying the foundation.
Show 12 more peopleShow fewer
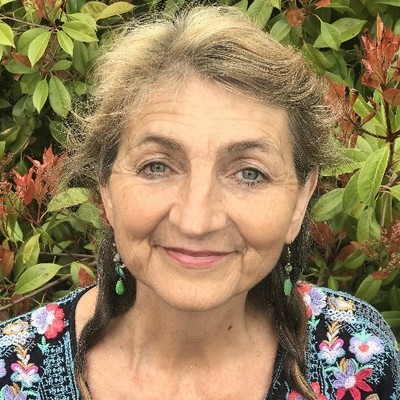
Asha is the founder and president of Pacific Domes — the industry leader in geodesic dome manufacturing. Over the last 40 years Asha's company has installed thousands of domes all over the country. Asha is a life-long learner, who actively studies and teaches Vastu Shastra (the science of creation) and Unified Field Theory. Asha is the mother of seven children and a birthday-twin of Buckminster Fuller!
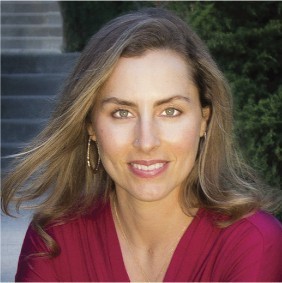
Crystal blends compassion, intuition, empathy, playfulness, and nature-sourced presence into her coaching. Through many years of coaching executives, entrepreneurs, and startup teams in Silicon Valley and Vienna, Austria, Crystal's focus is on what she loves most: Authenticity, Freedom and embracing our most natural and radically real self.

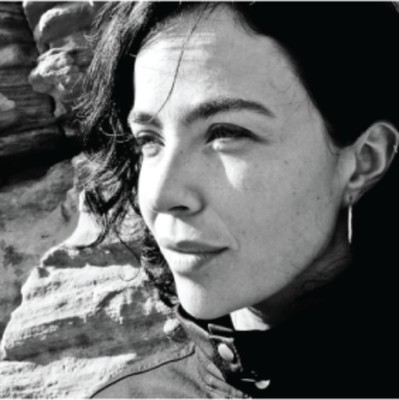

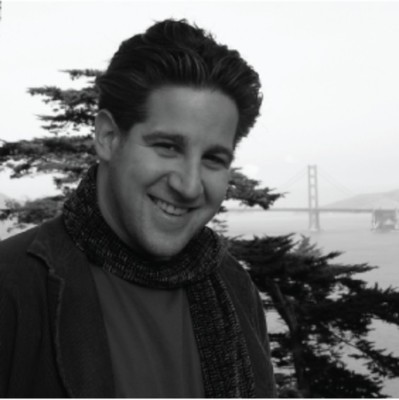
Eric is an award-winning architect, author, and global speaker. He is the Founding Principal of organicARCHITECT, a leader in biophilic and regenerative design. He was named one of the "Top 10 Most Influential Green Architects", has over 315,000 LinkedIn followers, is the author of 5 books, and holds a prestigious LEED Fellow award from the US Green Building Council.
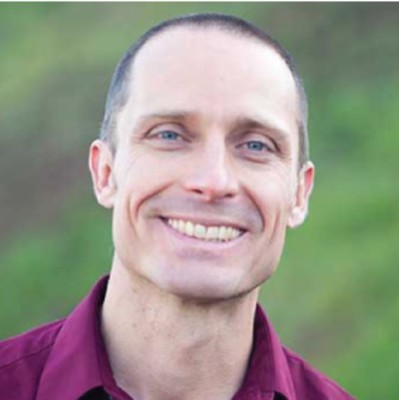
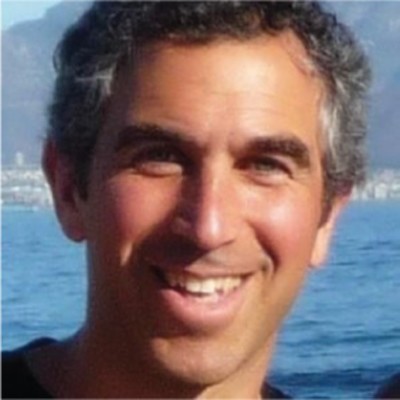
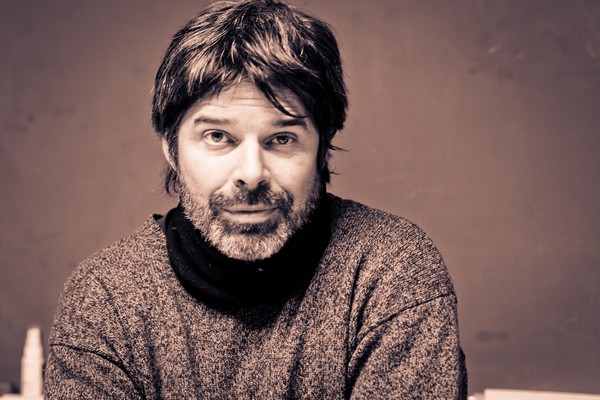
Mark is co-founder of The City Repair Project, Principal of Communitecture, and a national leader in the development of sustainable public places. In the last decade, he has directed, facilitated, or inspired designs for more than three hundred new community-generated public places in Portland, Oregon alone.

Martin is the author of Land: A New Paradigm for a Thriving World. Its message stands to educate policymakers and changemakers worldwide on a new economic model that takes economics to its proper foundation: the earth itself, the land and all that comes from it.

Reggie was the founder/CEO of Blue Tree Network. When Reggie learned of Māori-led efforts to give a NZ river legal personhood, it became the starting point for his work with EarthEquity, a nonprofit he is starting with Māori leaders within the environmental personhood movement.
Names and titles as disclosed on StartEngine, SEC Form C. Bios and photos come from the platform campaign page and may be out of date.
Reg CF annual-report compliance
Filed 7 of 7 annual reports (FY2019–FY2025)
Reg CF issuers must file a Form C-AR each year until a Rule 202(b) termination trigger is met.
SEC filings
View all 34 filings on EDGAR- Form DAug 31, 20260001626196-26-000005EDGAR
- Form C-ARMay 21, 20260001626196-26-000004EDGAR
- Form D/AMay 7, 20260001626196-26-000003EDGAR
- Form C-UMay 4, 20260001872856-26-000162EDGAR
- Form C-UFeb 25, 20260001872856-26-000061EDGAR
- Form CJan 27, 20260001872856-26-000026EDGAR
- Form C-UJan 27, 20260001872856-26-000027EDGAR
- Form CMay 8, 20250001670254-25-000564EDGAR
About this data. Figures are compiled from public sources — SEC EDGAR filings (Form C, C-AR, 1-A, 1-K) and funding-platform pages — and may be delayed, incomplete, or restated by the issuer. Financial statements are as reported by the issuer; each year is labeled with its assurance level (audited / reviewed / unaudited). A valuation cap is the conversion ceiling of a SAFE or convertible note, not an agreed company valuation; post-money figures are computed as pre-money plus amount raised and are not a traded price. Crowdonomics is not a broker-dealer, funding portal, or investment adviser; nothing here is investment advice or an offer to sell securities. Verify all figures against the linked EDGAR filings.