
GolfBoard by Sol Boards, Inc.
OperatingSol Boards Inc
Transportation
Surf the Earth!
Financials
FY2014–FY2020 · from SEC filings · hover any figure for its sourceFigures as reported by the issuer in the filing shown on hover. Each year’s pill shows the assurance level of its filed statements — audited, reviewed (CPA review, less than an audit), or unaudited, as the filing’s own report or certification states it. A dashed pill marked * is inferred instead: the SEC minimum for an offering that size, which the issuer may have exceeded. No pill means we couldn’t tell. Headcount is the filing’s point-in-time count, not a year-end average. Manually corrected figures are marked “Corrected”.
Valuation over rounds
Pre-money — the valuation set before each round’s money came inBlue bars are the pre-money valuation the company stated for a priced round. Dotted grey bars are our estimate for rounds that didn't state one: the round's share price × the shares outstanding in its filings. Same measure as blue, but rougher.
Share price over rounds
Disclosed sales come from the issuer's own filings (prior-offering lines, audited-statement notes) and are amount ÷ securities sold. A down round is a firm point more than 25 % below the previous firm point of the same share class on a comparable basis; the comparison ignores unverified and year-only lines.
Cap table
Share counts as of Dec 31, 2017| Class | Outstanding | Votes / share | Share of total | Last price |
|---|---|---|---|---|
| common stock | 7,787,289 | — | 100.0% | — |
Sold to the crowd
- Reg CF · Nov 2016800,000 shares at $1.25$1M· 879 investors
- Reg CF · Aug 2020241,865 shares at $1.25$302.3K· 377 investors
From the company's SEC filings: share counts per class, each class's voting and conversion terms, and the holders of 20% or more that Form C requires (officers and 10%+ holders on Form 1-A). Filings name only large holders, so most owners — including crowd investors — are not listed, and a holder's percentage may be of its own class rather than of the whole company. Prices and crowd share counts are in today's share terms — adjusted for splits and conversions since they were sold. Hover a figure for its filing.
Fundraising history
Team
11 people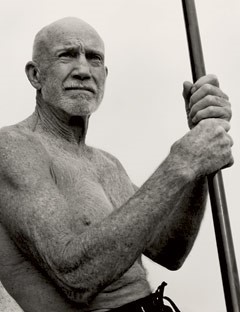
Largely credited for building the $15 billion+ health club market through innovative service offerings and celebrity based marketing, Don was founder and owner of Health & Tennis Corporation of America, which he sold to Bally Entertainment, where it was rebranded to Bally Total Fitness. The originator of idea of the GolfBoard, Don is Co-Founder of Sol Boards Inc., and is currently the Company’s largest shareholder.

Prior to joining the GolfBoard® team, John was with Bally Total Fitness for over 25 years in various sales and marketing positions, including Chief Marketing Officer and Chief Operating Officer. John helped grow the company to over 400 locations with over 20,000 employees, generating annual revenue of over $1B. John attended DePauw University, the Anderson School of Management at UCLA, and the Executive Education Program at the Kellogg School of Management at Northwestern University.
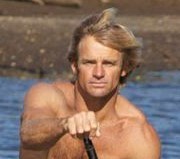
Famous for being the world’s premier big wave surfer and renowned waterman, Laird Hamilton is largely considered the primary influence behind many surfing innovations, including, tow-in surfing, stand-up paddle boarding, and hydrofoil boarding. Laird is involved with various entrepreneurial companies, including the co-founder of Sol Boards Inc., as well a unique underwater resistance training workout he has developed and branded XPT.
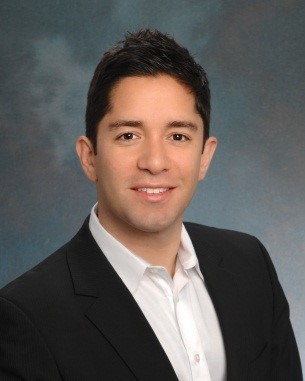
With over 15 years of management consulting experience, Ali combines financial expertise with tactical operating capabilities to businesses ranging from start-ups to Fortune 100 companies. Before co-founding his advisory firm, Ivy Venture Partners, Ali was a consultant at Bain & Company and held senior positions at Caesars Entertainment during its merger with Harrah’s and reported to the CFO of Burger King during its IPO. Ali has an MBA from Harvard Business School.

James is a strategy expert, having started his career with Bain & Company, where he developed growth strategies and devised business plans for some of the most successful global luxury and sports brands in the world. After leaving Bain in 2013, James co-founded Ivy Venture Partners, a business advisory and venture firm focused on developing and advising on winning business ventures for athletes, personalities and entertainers. James has an MBA from Wharton Business School.

Jeff has spent 35 years in startups and early stage business development ventures in the golf, technology, and digital media industries. Prior to GolfBoard®, Jeff held senior executive roles in sales, operations, and product development during his tenures at OakHill Country Club, Inter-ad Inc, Clarity Visual Systems, LG Electronics, and 3M Corporation. Jeff graduated from Indiana State University.

Luan is an award winning marketer who brings over 20 years of industry experience to GolfBoard, with recent in-depth experience in sports marketing. He is currently Head of Marketing for Condé Nast Golf Digest, and previously was Senior Director of Marketing, Golf & Tennis for Polo Ralph Lauren, and Marketing Services Director for Kiplinger Washington Editors. He has a Bachelors in Communication, Emphasis in Advertising, from California State University, Fullerton.

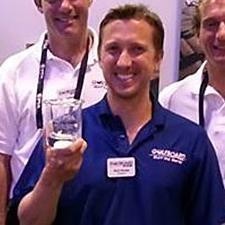
A co-founder and large shareholder, Mike Radenbaugh has lead much of the early stage design and development of the GolfBoard. Mike brings ten plus years of battery technology and technical product expertise to the company, including extensive experience with electric bicycles as the founder of Rad Power Bikes, as well as developing an electric propulsion system for stand-up paddleboards called the ElectraFin. Mike is a graduate of Humboldt State University and attended the University of California Davis for a master’s degree in Transportation Technology and Policy
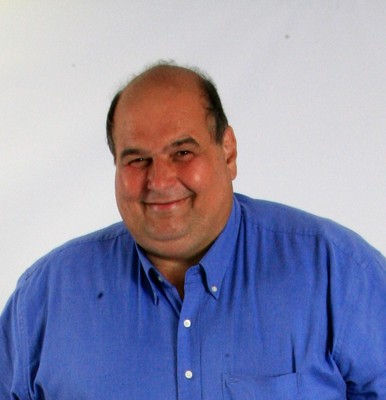
A major investor in Sol Board, Dean is COO of Microcast Technologies, the exclusive manufacturing partner with Sol Board. The development of the GolfBoard has been substantially enhanced by the engineering and prototyping work of Microcast Technologies Corporation. Dean is a graduate of Florida State University.
Show 2 more peopleShow fewer
Co-Founder of SolBoards, Paul is responsible for the early formation and initial early stage development of Golfboard. Paul is the Founder and Managing Member of GB Leasing, the preferred leasing partner to GolfBoard, which was made out of necessity as a way to finance GolfBoards to potential customers during the company’s early development. Paul is also the co-founder and current CEO of Laird Superfood a natural food company partnered with Laird Hamilton. Paul is a serial entrepreneur who has spent the last 26 years founding and taking on early stage development of a variety of businesses in multiple categories and industries.

Sol Boards Co-Founder and one of its largest shareholders, Star spent 6 years as a product rep for Quantya, an electric motorcycle company based in Switzerland. Star’s continues innovation efforts for clean and quiet electric vehicles. Star was the behind the original development of the high performance 4-wheel drive skateboard which led to the development of the GolfBoard.
Names and titles as disclosed on StartEngine, SEC Form C. Bios and photos come from the platform campaign page and may be out of date.
Reg CF annual-report compliance
Filed 5 of 10 annual reports (FY2016–FY2025)
Reg CF issuers must file a Form C-AR each year until a Rule 202(b) termination trigger is met.
SEC filings
View all 32 filings on EDGAR- Form C-UDec 1, 20210001665160-21-002135EDGAR
- Form C/AOct 25, 20210001665160-21-001871EDGAR
- Form C/AJul 26, 20210001665160-21-001325EDGAR
- Form C/AApr 30, 20210001665160-21-000796EDGAR
- Form C-ARApr 30, 20210001665160-21-000790EDGAR
- Form C/AFeb 16, 20210001665160-21-000166EDGAR
- Form C/ANov 17, 20200001665160-20-001426EDGAR
- Form CAug 21, 20200001665160-20-001079EDGAR
About this data. Figures are compiled from public sources — SEC EDGAR filings (Form C, C-AR, 1-A, 1-K) and funding-platform pages — and may be delayed, incomplete, or restated by the issuer. Financial statements are as reported by the issuer; each year is labeled with its assurance level (audited / reviewed / unaudited). A valuation cap is the conversion ceiling of a SAFE or convertible note, not an agreed company valuation; post-money figures are computed as pre-money plus amount raised and are not a traded price. Crowdonomics is not a broker-dealer, funding portal, or investment adviser; nothing here is investment advice or an offer to sell securities. Verify all figures against the linked EDGAR filings.