
Grady's Cold Brew
OperatingKebapolis LLC
Food & Beverage · Bronx, NY · Founded 2019
New Orleans–Style Cold Brew
Financials
FY2017–FY2022 · from SEC filings · hover any figure for its sourceFigures as reported by the issuer in the filing shown on hover. Each year’s pill shows the assurance level of its filed statements — audited, reviewed (CPA review, less than an audit), or unaudited, as the filing’s own report or certification states it. A dashed pill marked * is inferred instead: the SEC minimum for an offering that size, which the issuer may have exceeded. No pill means we couldn’t tell. Headcount is the filing’s point-in-time count, not a year-end average. Manually corrected figures are marked “Corrected”.
Valuation over rounds
Pre-money — the valuation set before each round’s money came inBlue bars are the pre-money valuation the company stated for a priced round.
Share price over rounds
Disclosed sales come from the issuer's own filings (prior-offering lines, audited-statement notes) and are amount ÷ securities sold. A down round is a firm point more than 25 % below the previous firm point of the same share class on a comparable basis; the comparison ignores unverified and year-only lines.
Cap table
Principal holders% as the filing states it, Apr 28, 2023
- Amy M. Keller2,120,400 Class A Common Stock50.0%of company
Sold to the crowd
- Reg CF · Dec 2019902,418 Class B Common Stock at $1.18$1.1M· 1,211 investors
From the company's SEC filings: share counts per class, each class's voting and conversion terms, and the holders of 20% or more that Form C requires (officers and 10%+ holders on Form 1-A). Filings name only large holders, so most owners — including crowd investors — are not listed, and a holder's percentage may be of its own class rather than of the whole company. Prices and crowd share counts are in today's share terms — adjusted for splits and conversions since they were sold. Hover a figure for its filing.
Fundraising history
Team
8 people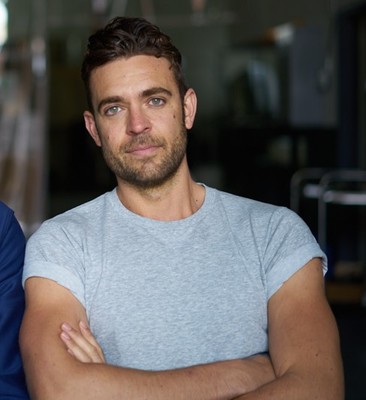
Dave is the Co-founder of Grady's Cold Brew, and was the person tasked with convincing buyers and consumers that not only was Grady's not beer, but, in fact, it was the next big thing in beverages. Before devoting his full attention to being a jack-of-all-trades at Grady's (sales director, brewery builder, truck driver, etc), Dave spent 5 years at Xerox Corporation, beginning in entry level sales and eventually managing their new Office Services Division for all IPG & WPP accounts, worldwide. Dave has been named to the Forbes 30-under-30 list, was featured in a national Wired Magazine & Jack Daniels advertising campaign, and has made appearances in Bustle, Bloomberg, Entrepreneur, and Runner's World.
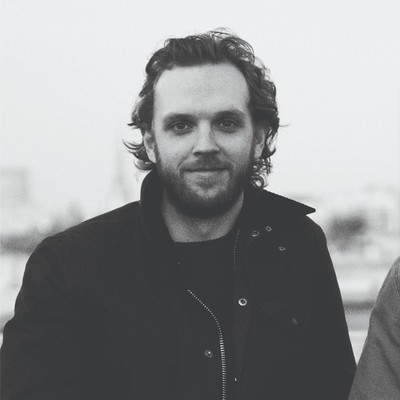
Grady is a cook, editor, writer, entrepreneur, and Co-founder of Grady's Cold Brew, one of the nation's first companies to bottle cold-brewed iced coffee. He wrote a grooming column for GQ.com called "Beauty Tested, Beast Approved" and has 10 years of experience as a production editor for magazines, including GQ, Men's Vogue, Details, Harper's Bazaar, and Condé Nast Traveler. He is a sought-after expert for iced-coffee stories: He has been filmed for NY1 and Vice, and has appeared in Bon Appétit, New York Magazine, and Women's Health, among other publications. Grady holds a BA in Journalism with an emphasis in Advertising from the University of Missouri–Columbia. As a serial entrepreneur, nothing infuriates Laird more than a good idea that dies before it's ever attempted. He lives with his two sons in Pelham, NY.
For over 90 years, Anchin has helped privately held food and beverage clients develop successful strategies that directly impact their growth and profitability. From assisting them with cash flow analysis to helping them strategize how to win more supermarket shelf space, we collaborate with our clients to give them the support they need to make smart business decisions. We work with management to analyze key performance indicators, review industry benchmarks, develop key employee retention and incentive plans, and help them drive business growth.

Propeller’s food & beverage team has earned the trust of some of the hottest emerging brands in the US. Over the course of nearly a decade we’ve taken companies like Krave Jerky and Sir Kensington’s from their first institutional capital raises all the way through exit and beyond. In the process, we’ve built relationships with the top investors in the industry — many of whom rely on Propeller to handle the finances for multiple portfolio companies. Whether it’s navigating the tactical challenges of distributor bill-backs and inventory controls or the strategic considerations of pricing and financial modeling, you won’t find a more experienced team.

Kyle is the Chief Executive Officer at Pack Labs. He co-founded Grady’s Cold Brew in 2011 and helped build the business nationally as COO. He has experience developing Grady’s through natural and conventional sales channels, overseeing operations and building out two cold-brew facilities in Brooklyn, and the Bronx. Before establishing the cold brew category and growing a multi-million dollar brand, Kyle worked at the Finance Alliance for Sustainable Trade.

Michael is a Founding Board Member of Grady's Cold Brew and the Co-founder and CEO of Lancium, a renewable energy and distributed computing company. He also serves as Co-chairman of Certified Holdings, a privately-held industrial automation and technology firm. Previously, Michael co-founded ROR Capital, a merchant bank focused on natural resources. Over several years, ROR partnered with leading Private Equity firms to successfully restructure a number of multi-billion dollar natural resource companies. Michael spent 10 years on Wall Street at several multi-billion hedge funds focused on natural resources and event-driven investments ultimately part of teams overseeing $1bn+ of investments in the space. Michael began his career at PriceWaterhouseCoopers with roles in the consulting and accounting divisions. Michael graduated Magna Cum Laude from Georgetown University with degrees in Accounting and Finance and is a member of the New York Society of Security Analysts and the CFA Institute.
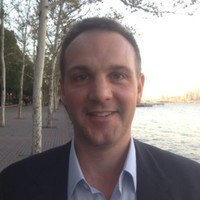
Tim has been a Director at Grady's since 2017. He is the Head of Business Development & Investor Relations at Cadian Capital Management and has 15+ years’ experience in the field. • Joined Cadian from Serengeti Asset Management where he was Director of Marketing and Investor Relations • Previously, he worked at Sandell Asset Management, Tremont Capital, and Deutsche Bank in business development and strategic equity allocation capacities • BA, International Studies, Colby College and MBA, Columbia Business School
Names and titles as disclosed on StartEngine, SEC Form C. Bios and photos come from the platform campaign page and may be out of date.
Reg CF annual-report compliance
Filed 3 of 7 annual reports (FY2019–FY2025)
Reg CF issuers must file a Form C-AR each year until a Rule 202(b) termination trigger is met.
SEC filings
View all 13 filings on EDGAR- Form C-TRDec 4, 20230001096906-23-002304EDGAR
- Form C-ARApr 28, 20230001665160-23-001046EDGAR
- Form C-ARMay 4, 20220001665160-22-001559EDGAR
- Form C-UJul 9, 20210001665160-21-001225EDGAR
- Form C-UApr 1, 20210001665160-21-000403EDGAR
- Form C/AJan 19, 20210001665160-21-000094EDGAR
- Form C/AOct 23, 20200001665160-20-001319EDGAR
- Form C/AAug 25, 20200001665160-20-001093EDGAR
About this data. Figures are compiled from public sources — SEC EDGAR filings (Form C, C-AR, 1-A, 1-K) and funding-platform pages — and may be delayed, incomplete, or restated by the issuer. Financial statements are as reported by the issuer; each year is labeled with its assurance level (audited / reviewed / unaudited). A valuation cap is the conversion ceiling of a SAFE or convertible note, not an agreed company valuation; post-money figures are computed as pre-money plus amount raised and are not a traded price. Crowdonomics is not a broker-dealer, funding portal, or investment adviser; nothing here is investment advice or an offer to sell securities. Verify all figures against the linked EDGAR filings.