
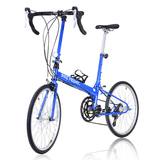
Bike Friday
OperatingGreen Gear Cycling, Inc.
Transportation · Euguene, CA
Financials
FY2015–FY2018 · from SEC filings · hover any figure for its sourceFigures as reported by the issuer in the filing shown on hover. Each year’s pill shows the assurance level of its filed statements — audited, reviewed (CPA review, less than an audit), or unaudited, as the filing’s own report or certification states it. A dashed pill marked * is inferred instead: the SEC minimum for an offering that size, which the issuer may have exceeded. No pill means we couldn’t tell. Headcount is the filing’s point-in-time count, not a year-end average. Manually corrected figures are marked “Corrected”.
Fundraising history
Team
19 people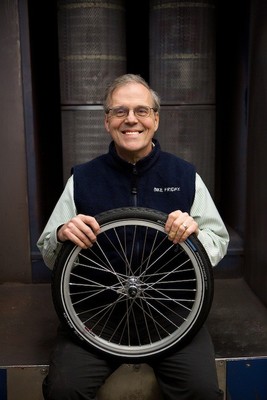
Alan has had a deep love for the benefits of a biking lifestyle since he was a teenager in Fargo, North Dakota. With a desire to make things that help people live a healthier more active life he has founded several businesses and designed many successful products in his life. He founded the original Burley Bags that became Burley Design in 1969. He later co-founded Advanced Training Products and Green Gear Cycling (dba Bike Friday) with his brother Hanz in 1992.
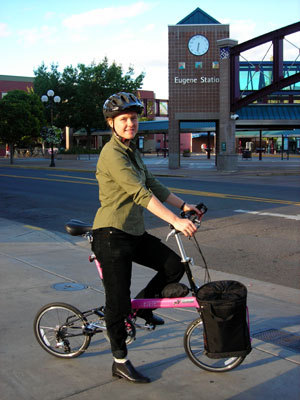
Hanna grew up in the Bike Friday family. The oldest daughter of Co-founder, Alan Scholz, Hanna was lacing wheels, counting inventory, sewing travel bags and painting racks by the time she graduated high school. In her early 20s, she started full time work at Bike Friday and eventually moved into the marketing department. Trained and inspired her Dad’s values of human power and small resource impact on the earth, she lives car-free in the converted garage right along the bike path. She either rides her bike or walks to work in the mornings. Hanna also lives in a Tiny home, see how she really lives a sustainable lifestyle.

Jordan moved to Oregon for graduate school and never left. An avid bicyclist, Jordan has worked in the biking industry off and on for more than 15 years. As Director of Operations at Bike Friday, Jordan manages the value streams for the company including service and production. In other words, he finds problems and solves them. He believes he has found the perfect job and we believe we found the perfect operations manager.
Clayton has been a Bike Friday employee since 2017
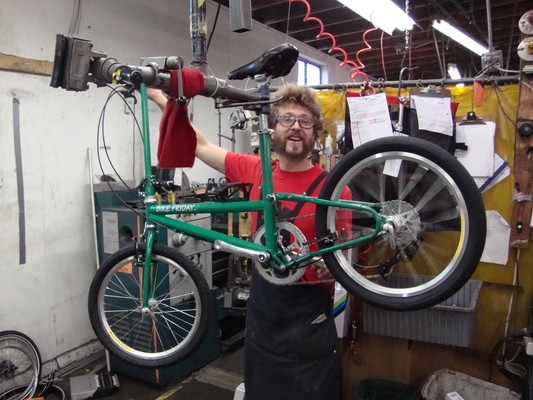
Damon has been a Bike Friday employee since 2009
Fraeda has been a Bike Friday employee since birth
Kent has been a Bike Friday employee since 2015

Marilyn has been a Bike Friday employee since 2006

Matthew has been a Bike Friday employee since 2011
Show 10 more peopleShow fewer
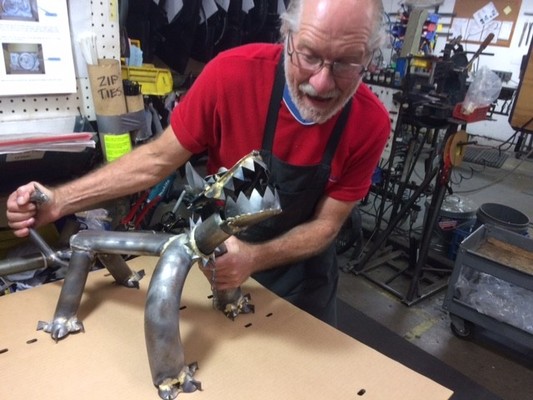
Merle has been a Bike Friday employee since 2004
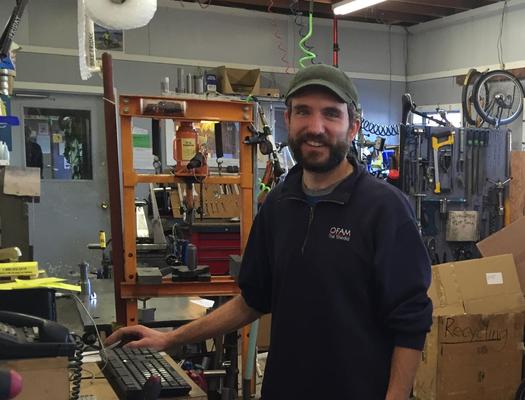
Michael has been a Bike Friday employee since 2010
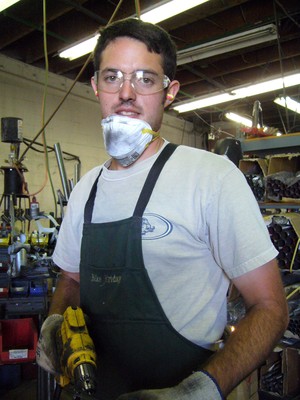
Mike has been a Bike Friday employee since 2005

Peter specializes in recreational, commuting, touring, road, mountain, single speeds, tandems and most things bike related. Peter believes that bikes are one of the best inventions ever, and a positive source of energy for a healthier, happier way of life. With more than 17 years of knowledge and experience, working in just about every department at Bike Friday, Peter feels confident in understanding and recommending the right Bike Friday for you.
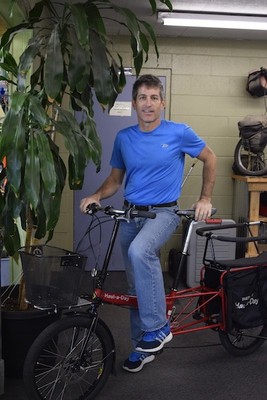
Seven year Bike Friday veteran Steve Strickland is an avid cyclist, tour guide, surfer, and master of the grill. He has ridden his New World Tourist on many adventures on multiple continents.

Tim has been a Bike Friday employee since 2000

Todd has been a Bike Friday employee since 2010

Walter is one of Bike Friday’s old timers, having worked in nearly every part of the company: production, inventory, service, and now as a Professional Bicycle Travel Consultant. Pick a destination and he’ll help facilitate a Bike Friday to take with you on your travels! Walter lives, breathes and rides Bike Friday. He is an everyday commuter who wholeheartedly believes in the bicycle as a revolutionary machine.
Gary has been a Bike Friday employee since 2008
We have a few employees who don't like having their photos taken or being listed on the internet. But we promise, they do exist!
Names and titles as disclosed on SEC Form C, StartEngine. Bios and photos come from the platform campaign page and may be out of date.
Reg CF annual-report compliance
Filed 1 of 9 annual reports (FY2017–FY2025)
Reg CF issuers must file a Form C-AR each year until a Rule 202(b) termination trigger is met.
SEC filings
About this data. Figures are compiled from public sources — SEC EDGAR filings (Form C, C-AR, 1-A, 1-K) and funding-platform pages — and may be delayed, incomplete, or restated by the issuer. Financial statements are as reported by the issuer; each year is labeled with its assurance level (audited / reviewed / unaudited). A valuation cap is the conversion ceiling of a SAFE or convertible note, not an agreed company valuation; post-money figures are computed as pre-money plus amount raised and are not a traded price. Crowdonomics is not a broker-dealer, funding portal, or investment adviser; nothing here is investment advice or an offer to sell securities. Verify all figures against the linked EDGAR filings.