

Healthycell
OperatingLife Science Institute LLC
Healthcare · Mount Pleasant, DE · Founded 2012
Products use MICROGEL technology to deliver nutrients you can absorb in a pill free experience
Financials
FY2019–FY2025 · from SEC filings · hover any figure for its sourceFigures as reported by the issuer in the filing shown on hover. Each year’s pill shows the assurance level of its filed statements — audited, reviewed (CPA review, less than an audit), or unaudited, as the filing’s own report or certification states it. A dashed pill marked * is inferred instead: the SEC minimum for an offering that size, which the issuer may have exceeded. No pill means we couldn’t tell. Headcount is the filing’s point-in-time count, not a year-end average. Manually corrected figures are marked “Corrected”.
Valuation over rounds
Pre-money — the valuation set before each round’s money came inBlue bars are the pre-money valuation the company stated for a priced round.
Share price over rounds
Disclosed sales come from the issuer's own filings (prior-offering lines, audited-statement notes) and are amount ÷ securities sold. A down round is a firm point more than 25 % below the previous firm point of the same share class on a comparable basis; the comparison ignores unverified and year-only lines, and each class is drawn as its own line.
Cap table
Principal holders% as the filing states it, Apr 30, 2026
- Vincent C. Giampapa, MD7,929,000 Common Class A40.0%of company
- Vincent C. Giampapa, MD267,125 Common Class B40.0%of company
- Vincent C. Giampapa, MD1,870,657 B-2 Preferred40.0%of company
- December2,025 shares26.3%of company
- Douglas V. Giampapa267,237 B-2 Preferred20.0%of company
- Douglas V. Giampapa1,200,000 Class A Bridge Preferred20.0%of company
- Douglas V. Giampapa267,125 Common Class B20.0%of company
- Success Asis15.8%of company
- Vincent C. Giampapa11.9%of company
- ea.)5.86%of company
- Natureza Opportunity Fund I LP5.59%of company
- Keen Growth Capital Fund II LP4.58%of company
- John C. Malone4.46%of company
- Essential Wellness, LLC3.03%of company
- XML III LLC1.89%of company
- Front Porch Fund1.84%of company
- VentureSouth Investments D LLC1.6%of company
- VentureSouth Mallard Fund LLC1.56%of company
- Michael Costello1.39%of company
- Goldea, Inc.1.18%of company
- Start Engine SPV0.99%of company
- VentureSouth Angel Fund V LP0.7%of company
- VentureSouth Vicinity1 shares0.5%of company
- VentureSouth Angel Fund VI LP0.39%of company
- StartEngine Corporate0.03%of company
Sold to the crowd
- Reg CF · Oct 2021868,156 shares at $0.29$251.8K· 259 investors
From the company's SEC filings: share counts per class, each class's voting and conversion terms, and the holders of 20% or more that Form C requires (officers and 10%+ holders on Form 1-A). Filings name only large holders, so most owners — including crowd investors — are not listed, and a holder's percentage may be of its own class rather than of the whole company. Prices and crowd share counts are in today's share terms — adjusted for splits and conversions since they were sold. Hover a figure for its filing.
Fundraising history
Team
13 people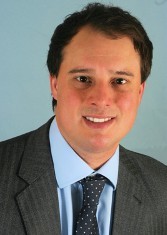
Doug is a graduate of Cornell University. He led the turnaround of an insolvent company that became Healthycell. He built the team from the ground up, raised capital, acquired rights to MICROGEL™ technology, and branded the company. As the Founder, CEO, and Board Member, he leads the company, manages staff and operations, and is accountable for hitting milestones and ultimate company success. He also leads R&D initiatives.
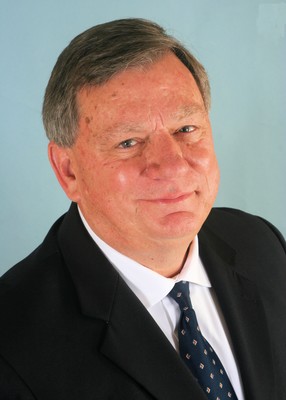
Joe is a CPA who previously worked with Deloitte and UPM (United Paper Mill), developing expertise in SEC (10-K, 10-Q, 8-K) reporting from public entity work, audit coordination, and financial modeling. His broad experience includes wholesale and retail apparel, medical device, pharma, manufacturing, and distribution industries. He manages Healthycell's financial strategy, budgeting and planning, bookkeeping, tax work, and COGS reduction.
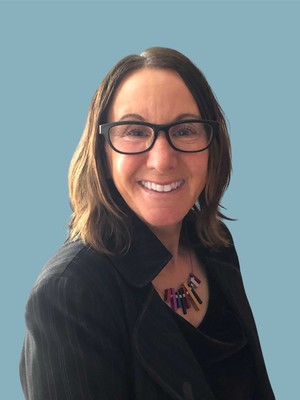
Jill is a former Executive VP for New Hope Natural Media (the natural product industry's largest trade organization), Renew Life Formulas, and Co-founder of a children's drink company. With 25 years of experience in the natural products industry, she successfully built sales teams that have hit sales goals with each company. She leads independent and chain retail sales growth for Healthycell and manages distributors UNFI and KeHE.
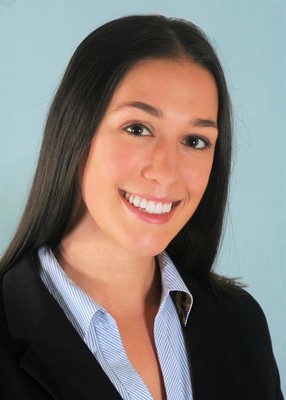
Katie has a degree in Nutritional Science and Dietetics from Rutgers University, and she is a certified health coach via Precision Nutrition. She managed Healthycell customer service for five years and has now moved into the role of Director of Corporate Training. She completes the product training curriculum, onboards and trains retail staff at independent and chain retail stores.
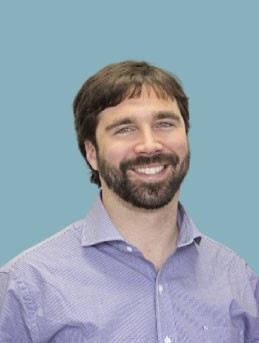
Aaron has used his attention to detail, problem solving skills and creativity to help a wide variety of quality companies and brands launch, grow and thrive. His deep-seated entrepreneurial spirit is now focused on driving operational efficiencies in supply chain, logistics and inventory management for Healthycell.
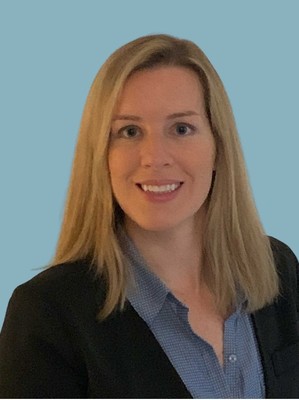
Dr. Nobel is Executive Chairman since 2014 of the Nobel Sustainability Trust Foundation in Zürich, which gives annual awards for inventions and developments in sustainable technology. He participated in the initial introduction of magnetic resonance imaging as vice president of Fonar Corporation and served as Executive Chairman of the Magnetkameran Group from 1991 to 2006. For 15 years he represented the Nobel Family as Vice Chairman and Chairman of its Board of Directors. He has consulted for Unesco in Paris and the United Nations Social Affairs Division in Geneva for evaluation of drug abuse prevention programs. His academic position is that of Distinguished Professor at the Research Institute for Natural Science and Technology of Osaka City University and guest Professor at the Peace Research Institute of the Soka University, Tokyo and the Kyosei Faculty of Seisa University, Oiso in Japan.
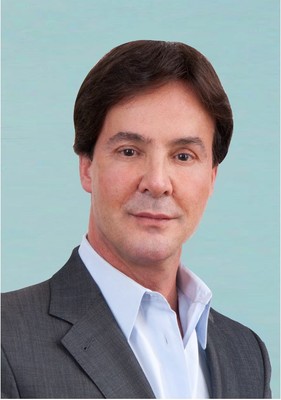
Dr. Giampapa is a world-renowned medical doctor, surgeon, health author, inventor, and cellular aging expert. He has been featured on Discovery Science Channel's stem cell special with Stephen Hawking, FOX, CNN, and several other media outlets. He formulates products for Healthycell, oversees clinical studies, and serves as a key opinion leader in public forums. Dr. Giampapa serves this role in a part-time capacity (approximately 4 hours per week).
Show 4 more peopleShow fewer
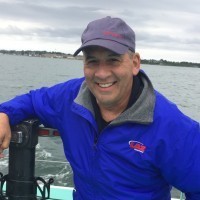
Jonathan is the Managing Partner of KEEN Growth Capital (KGC), a venture capital firm investing in natural food and Pharma with an eye towards improved health and nutrition. From early stage CPG to patented food tech and food science, KGC has created top decile returns while delivering social impact.
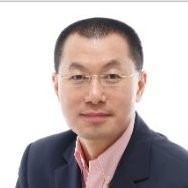
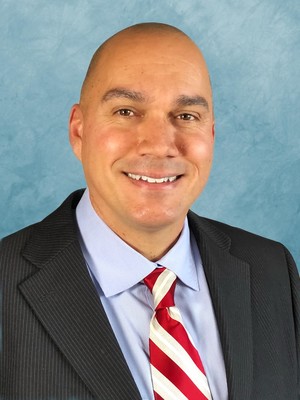
Travis has helped early-stage health companies grow sales via digital marketing, strategic partnerships, and affiliate programs. His proven customer acquisition and growth hacking strategies helped Chili Technology grow revenue from $1 million to over $8 million in 2.5 years and increase U.S. sales for the supplement brand Activation Products by more than $2 million per year. He manages Healthycell’s partnerships, affiliates, SEM, and digital technology stack. Travis serves this role as a 1/2 FTE (approximately 20 hours per week), with core marketing responsibilities delegated to competent agencies.
Names and titles as disclosed on StartEngine, SEC Form C. Bios and photos come from the platform campaign page and may be out of date.
Reg CF annual-report compliance
Filed 5 of 5 annual reports (FY2021–FY2025)
Reg CF issuers must file a Form C-AR each year until a Rule 202(b) termination trigger is met.
SEC filings
View all 11 filings on EDGAR- Form C-ARApr 30, 20260001873475-26-000001EDGAR
- Form C-ARApr 9, 20250001665160-25-000556EDGAR
- Form C-ARApr 16, 20240001665160-24-000358EDGAR
- Form C-ARApr 17, 20230001665160-23-000643EDGAR
- Form C-UOct 4, 20220001665160-22-002588EDGAR
- Form C-ARMay 2, 20220001665160-22-001373EDGAR
- Form C-UJan 19, 20220001665160-22-000102EDGAR
- Form C/AJan 7, 20220001665160-22-000055EDGAR
About this data. Figures are compiled from public sources — SEC EDGAR filings (Form C, C-AR, 1-A, 1-K) and funding-platform pages — and may be delayed, incomplete, or restated by the issuer. Financial statements are as reported by the issuer; each year is labeled with its assurance level (audited / reviewed / unaudited). A valuation cap is the conversion ceiling of a SAFE or convertible note, not an agreed company valuation; post-money figures are computed as pre-money plus amount raised and are not a traded price. Crowdonomics is not a broker-dealer, funding portal, or investment adviser; nothing here is investment advice or an offer to sell securities. Verify all figures against the linked EDGAR filings.