
InGen Dynamics, Inc.
OperatingSoftware & AI · Palo Alto, CA
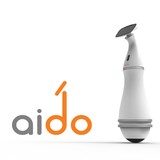
Aido is an interactive personal home robot. He’s an all in one package that comes with the best of home automation, security, assistance, entertainment and much more! Awarded "GameChanger" of 2016 by the world's leading tech magazine (T3), Aido raised over $850,000 in pre-orders.
Financials
FY2014–FY2025 (no data for FY2019, FY2020) · from SEC filings · hover any figure for its sourceChart shows the most recent 8 fiscal years; 2 earlier years are in the table below.
Figures as reported by the issuer in the filing shown on hover. Each year’s pill shows the assurance level of its filed statements — audited, reviewed (CPA review, less than an audit), or unaudited, as the filing’s own report or certification states it. A dashed pill marked * is inferred instead: the SEC minimum for an offering that size, which the issuer may have exceeded. No pill means we couldn’t tell. Headcount is the filing’s point-in-time count, not a year-end average. Manually corrected figures are marked “Corrected”.
Valuation over rounds
Pre-money — the valuation set before each round’s money came inDotted grey bars are our estimate for rounds that didn't state one: the round's share price × the shares outstanding in its filings. Same measure as blue, but rougher.
Share price over rounds
Disclosed sales come from the issuer's own filings (prior-offering lines, audited-statement notes) and are amount ÷ securities sold. A down round is a firm point more than 25 % below the previous firm point of the same share class on a comparable basis; the comparison ignores unverified and year-only lines.
Cap table
Share counts as of Apr 21, 2023| Class | Outstanding | Votes / share | Share of total | Votes | Liquidation | Last price |
|---|---|---|---|---|---|---|
| Class B Common Stock | 226,547 | 1 | 3.37% | 0.02% | paid 2nd | — |
| Class A Common Stock | 6,500,000 | 200 | 96.6% | 100.0% | — | — |
| Total | 6,726,547 | 100% | 100% |
Principal holders% as the filing states it, Apr 30, 2025
- Arshad Hisham6,500,000 Class A Common Stock99.7%of votes
Sold to the crowd
- Reg CF · Dec 2016129,679 shares at $1.41$182.8K· 273 investors
- Reg CF · Aug 2023280 Class D Common Stock at $40.00$11.2K
From the company's SEC filings: share counts per class, each class's voting and conversion terms, and the holders of 20% or more that Form C requires (officers and 10%+ holders on Form 1-A). Filings name only large holders, so most owners — including crowd investors — are not listed, and a holder's percentage may be of its own class rather than of the whole company. Prices and crowd share counts are in today's share terms — adjusted for splits and conversions since they were sold. Hover a figure for its filing.
Fundraising history
Team
14 people
Mr. Hisham is a serial entrepreneur and a Cranfield University (UK) MBA. He has built and run hardware automation companies. He has published research papers on Robotics and has held senior roles in the past at IBM, Govt. of Australia, and Toyota. Mr. Hisham is a frequent speaker on the Robotics most recently as a keynote speaker at the annual IEEE Robotics Symposium, Boston Consulting Group’s annual AI and machine learning event as well as at the industry-leading Robo-Business event among others.

Experienced finance professional with extensive operational, finance and sales and marketing background. Texas Austin MBA and previous roles include Director at Hewlett Packard.
Show 5 more peopleShow fewer

A hardware and electronics specialist with more than 15 years experience in development of machine control, firmware for special purpose machines, PLC programming., weapon simulators for the Army, control systems for truck driving simulators, and special purpose motors. Previous projects include Traab Engineering, Autoliv, Digicon, GKB Lenses, and, the Army.

A mechanical engineering consultant with around 25 years experience working with companies including General Electric, Emerson, UTC, RPDG, and, GoProto. Expert in New Product Development, Industrial Design, Mechanical Engineering, and Prototyping.

A Texas Instruments alumnus with more than 15 years experience of creating ground breaking technologies including a UNDP showcased project, complex electoral polling, GPS based data collection and state-of-the-art applications. Experience also involved developing AI/software for Soccer based Robots.
Names and titles as disclosed on SEC Form 1-A, SEC Form C, StartEngine. Bios and photos come from the platform campaign page and may be out of date.
Reg CF annual-report compliance
Filed 6 of 10 annual reports (FY2016–FY2025)
Reg CF issuers must file a Form C-AR each year until a Rule 202(b) termination trigger is met.
SEC filings
View all 20 filings on EDGAR- Form C-ARMay 29, 20260001690888-26-000003EDGAR
- Form C-ARApr 30, 20250001690888-25-000001EDGAR
- Form C-ARMay 24, 20240001690888-24-000002EDGAR
- Form C-UMar 26, 20240001690888-24-000001EDGAR
- Form C/ANov 29, 20230001690888-23-000004EDGAR
- Form C-UOct 16, 20230001690888-23-000003EDGAR
- Form C-USep 22, 20230001690888-23-000002EDGAR
- Form CAug 30, 20230001690888-23-000001EDGAR
About this data. Figures are compiled from public sources — SEC EDGAR filings (Form C, C-AR, 1-A, 1-K) and funding-platform pages — and may be delayed, incomplete, or restated by the issuer. Financial statements are as reported by the issuer; each year is labeled with its assurance level (audited / reviewed / unaudited). A valuation cap is the conversion ceiling of a SAFE or convertible note, not an agreed company valuation; post-money figures are computed as pre-money plus amount raised and are not a traded price. Crowdonomics is not a broker-dealer, funding portal, or investment adviser; nothing here is investment advice or an offer to sell securities. Verify all figures against the linked EDGAR filings.