

LANIKAI BREWING COMPANY
OperatingLanikai Brewing Company LLC
Alcohol · Kailua, HI · Founded 2011
Island-inspired craft beer and spirits
Financials
FY2016–FY2025 (no data for FY2018, FY2019, FY2020) · from SEC filings · hover any figure for its sourceFigures as reported by the issuer in the filing shown on hover. Each year’s pill shows the assurance level of its filed statements — audited, reviewed (CPA review, less than an audit), or unaudited, as the filing’s own report or certification states it. A dashed pill marked * is inferred instead: the SEC minimum for an offering that size, which the issuer may have exceeded. No pill means we couldn’t tell. Headcount is the filing’s point-in-time count, not a year-end average. Manually corrected figures are marked “Corrected”.
Valuation over rounds
Pre-money — the valuation set before each round’s money came inBlue bars are the pre-money valuation the company stated for a priced round.
Cap table
Share counts as of Mar 31, 2026| Class | Outstanding | Votes / share | Share of total | Liquidation | Last price |
|---|---|---|---|---|---|
| Class P Preferred Unitspreferred | 4,293,998 | 1 | 53.9% | 1× · paid 1st | — |
| Units | 3,677,274 | — | 46.1% | — | $2.04May 2023 |
| Total | 7,971,272 | 100% |
Principal holders% as the filing states it, Mar 31, 2026
- Steven R. Haumschild Living Trust2,600,000 Class B Employee Units58.0%of Class B Employee Units
- Steven R. Haumschild Living Trust3,222,732 Class A Founders Units54.0%of Class A Founders Units
- Allan D. Darling Trust2,269,805 Class A Founders Units38.0%of Class A Founders Units
- Allan D. Darling Trust877,274 Class B Employee Units20.0%of Class B Employee Units
- Allan D. Darling Trust288,348 Class P Preferred Units7%of Class P Preferred Units
Sold to the crowd
- Reg CF · May 2023146,340 shares at $2.04$298.5K· 306 investors
From the company's SEC filings: share counts per class, each class's voting and conversion terms, and the holders of 20% or more that Form C requires (officers and 10%+ holders on Form 1-A). Filings name only large holders, so most owners — including crowd investors — are not listed, and a holder's percentage may be of its own class rather than of the whole company. Prices and crowd share counts are in today's share terms — adjusted for splits and conversions since they were sold. Hover a figure for its filing.
Fundraising history
Team
12 people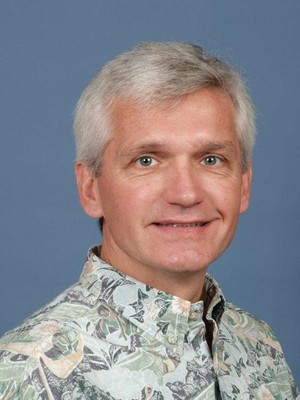
Allan (Al) Darling functions as the Financial Director who oversees the accounting and financial administration for the company. He is a CPA with over 30 years of corporate leadership experience in a variety of industries, including 6 years as the Director of Internal Audit for Alexander & Baldwin (A&B) in Honolulu.. Al earned his BA degree in Accounting from National University in San Diego and graduated from University of Hawaii’s Shidler College of Business Executive MBA Program in May 2011. Al is an enthusiastic connoisseur of finer craft brews as well as an accomplished adventurer. He is an OC1 Paddler and enjoys exploring the islands in his spare time.
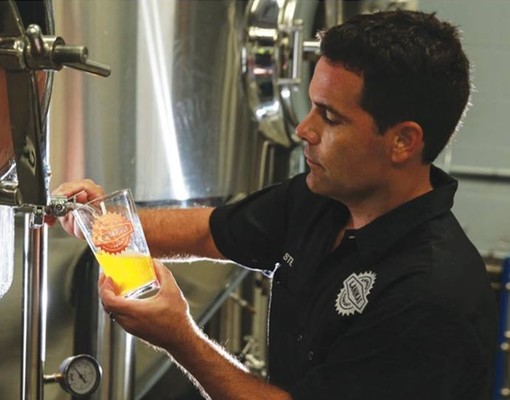
Mr Haumschild is an accomplished and motivated serial entrepreneur with over 25 years of leadership experience. Awarded Hawaii Entrepreneur of the Year (2019)by the Hawaii Venture Capitalist Association and recognized by the State of Hawaii Legislature and 40 Under 40 business leaders (2013) from Pacific Business news. Mr. Haumschild graduated from the University of Hawaii Shidler College of Business Executive Master of Business program in 2011 also holding degrees from The Ohio State University in Evolution, Ecology and Organismal Biology (Bachelors of Sciences). He is a graduate of Siebel Institute of Technology Associates in Brewing Program as well as a Certified Cicerone. Mr Haumschild is also a professional business consultant, tailored for business both domestically and international, from start-ups to exit.

After graduating from Colorado State University with a degree in Business Marketing, Sam began coaching entrepreneurs of small businesses struggling to grow their revenue. She spent a little over 2 years helping people grow million dollar companies across the country before jumping into the Lanikai Brewing family. She has multiple marketing certificates, years of graphic design experience, and a strong sales-driven personality. Sam is extremely active in her community and family here in Hawaii. She is a CrossFit coach at a local gym and competes often. Sam also teaches horeseback riding lessons at a theraputic riding center in Waimanalo. Sam is a surfing, snorkeling, running, and hiking enthusiast - partaking in many competitions/events across the island.
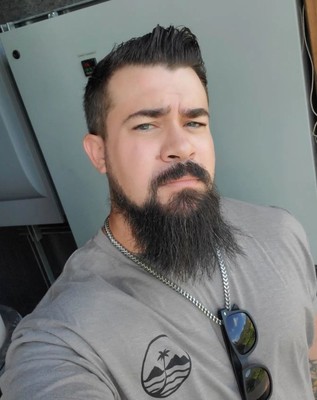
Jonathan spent 4 years in the Navy as a Cryptological Technician. He attained multiple degrees at a young age and can speak 7 different languages. Jonathan began distilling at the age of 12, making moonshine in the mountains of West Virginia. He was on Discovery Channel's 'Moonshiners' (Season 3) and is a beverage consultant for 6 different distilleries and 5 wineries across the country. Jonathan has been with Lanikai Brewing for around 2 years and is helping to establish the newest name in small batch spirits here in Hawaii. Jonathan is a well-renowned powerlifter and Strongman competitor. He recently qualified for the World Spartan Trifecta Championship. Mr. Brammer enjoys spending time with his family, free diving, spearfishing, and is currently working on his very own reef growth/reef plugging project.
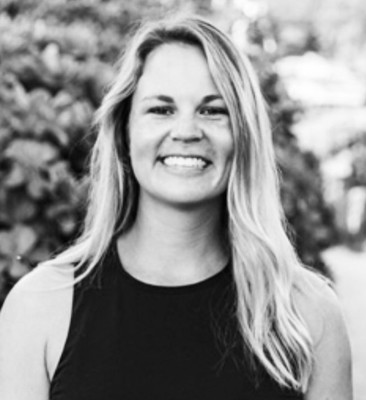
Katie received her bachelors degree in Communications from ASU. She has been apart of the Lanikai Brewing family for 6 years now, overseeing everything from our Kailua taproom to distributor sales. Katie is well accomplished in multiple areas of this company and continues to be a major asset to our team. Katie recently became a mom and has been enjoying time with her new family. While she is not working or taking care of her little one, she loves to surf, hike, practice yoga, and read on the beach.

Kumu Hula Malia is a Kanaka ʻŌiwi & 18+ year Native Hawaiian cultural advisor. She has served as Chief of Staff to Hawaii State Representative Mele Carroll (Vice Chair of Committee on Hawaiian Affairs), and as senior political aide at the Office of Hawaiian Affairs for Boardchairperson Haunani Apoliona. In addition to her extensive background in government & business, in 2019 Kumu Hula Malia ʻūniki as Hoʻopaʻa Laeoʻo (Chanter). Then in 2021, after more than 30 years of study, Kumu Hula Malia ʻūniki as a Kumu Hula in an ʻailolo ceremony. Kumu Malia holds an Executive M.B.A. from the University of Hawaii at Manoa and a B.A. in Political Science from Pepperdine University. Kumu Hula Malia continues her work as a Hawaiian cultural advisor as well as instructs in the Hawaiian arts of Oli, Hula kahiko & Hula ʻauana.

Marne grew up in Montana and graduated from Gonzaga University with a degree in Applied Communications, working in PR for years before ending up in Hawaii and falling into the local craft beer scene. Marne is going on 6 years with Lanikai Brewing Company. She orignially started working on Friday nights in the small tasting room at the brewery and was instrumental in helping open the Kailua taproom in 2017. Now days, Marne is the Kailua location General Manager. She equally loves to get lost on a sweaty hike in the jungle, get in the water and look for turtles or swim with sharks, or relax on the beach and watch a sunrise or sunset that you can only catch on the beaches of Hawaii.
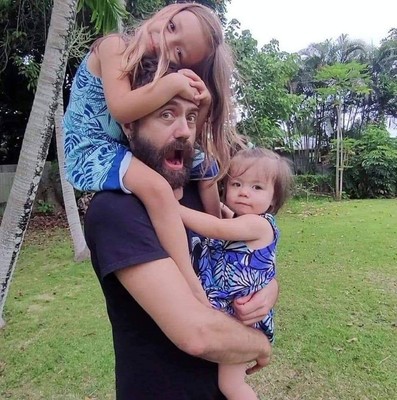
Scott attended Metropolitan State University in Denver, receiving a degree in Electrical Engineering. After meeting his wife, they moved to Hawaii to start their family on her home island. Scott began as a home brewer. After about 7 years making his own concoctions, he became interested in brewing on a larger scale. Scott came into Lanikai Brewing as a Brewing Assistant - scrubbing the brewery floors - and has worked his way up over the last 6 years to a full time brewer for our company. Scott is a loving father to two girls and enjoys playing hockey, partaking in CrossFit, and spending time with his family in his free time.
Show 3 more peopleShow fewer
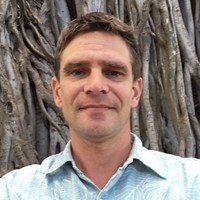
Dan’s background includes a degree in Environmental Science from Oregon State University. While at OSU, he took a course in fermentation science which sparked his interest in brewing. Following college, he moved to Hawaii and has 25+ years working in the environmental/construction consulting industry.
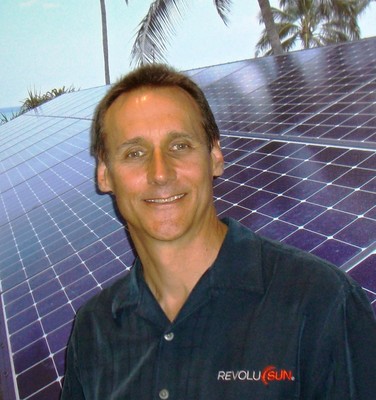
Julian Ritchey is a University of Texas at Austin Graduate with degrees in Finance and Pre-Dental. He has 30 years of experience in the hospitality industry as an owner, manager, consultant and bartender in bars, restaurants, hotels, and nightclubs. Upon moving to Hawaii in 2010, Julian changed careers and is now one of Hawaii’s leaders as a renewable energy project developer. He is the senior developer with RevoluSun, Hawaii’s number one PV installer. He started with RevoluSun on 05/01/2010.
Names and titles as disclosed on StartEngine, SEC Form C. Bios and photos come from the platform campaign page and may be out of date.
Reg CF annual-report compliance
Filed 3 of 8 annual reports (FY2018–FY2025)
Reg CF issuers must file a Form C-AR each year until a Rule 202(b) termination trigger is met.
SEC filings
- Form C-ARMar 31, 20260001748070-26-000004EDGAR
- Form C-ARJun 11, 20250001665160-25-001204EDGAR
- Form C-ARJun 17, 20240001665160-24-000995EDGAR
- Form C-UJul 12, 20230001665160-23-001508EDGAR
- Form CMay 9, 20230001665160-23-001228EDGAR
- Form C-WApr 21, 20230001665160-23-000686EDGAR
- Form COct 16, 20180001670254-18-000489EDGAR
About this data. Figures are compiled from public sources — SEC EDGAR filings (Form C, C-AR, 1-A, 1-K) and funding-platform pages — and may be delayed, incomplete, or restated by the issuer. Financial statements are as reported by the issuer; each year is labeled with its assurance level (audited / reviewed / unaudited). A valuation cap is the conversion ceiling of a SAFE or convertible note, not an agreed company valuation; post-money figures are computed as pre-money plus amount raised and are not a traded price. Crowdonomics is not a broker-dealer, funding portal, or investment adviser; nothing here is investment advice or an offer to sell securities. Verify all figures against the linked EDGAR filings.