

Liberty Access Technologies
OperatingLiberty PlugIns, Inc.
Healthcare · Santa Barbara, CA · Founded 2009
Electric Fleet Charging Infrastructure
Financials
FY2017–FY2025 · from SEC filings · hover any figure for its sourceChart shows the most recent 8 fiscal years; 1 earlier year is in the table below.
Figures as reported by the issuer in the filing shown on hover. Each year’s pill shows the assurance level of its filed statements — audited, reviewed (CPA review, less than an audit), or unaudited, as the filing’s own report or certification states it. A dashed pill marked * is inferred instead: the SEC minimum for an offering that size, which the issuer may have exceeded. No pill means we couldn’t tell. Headcount is the filing’s point-in-time count, not a year-end average. Manually corrected figures are marked “Corrected”.
Valuation over rounds
Pre-money — the valuation set before each round’s money came inBlue bars are the pre-money valuation the company stated for a priced round.
Share price over rounds
Disclosed sales come from the issuer's own filings (prior-offering lines, audited-statement notes) and are amount ÷ securities sold. A down round is a firm point more than 25 % below the previous firm point of the same share class on a comparable basis; the comparison ignores unverified and year-only lines.
Cap table
Share counts as of Apr 30, 2026| Class | Outstanding | Votes / share | Share of total | Last price |
|---|---|---|---|---|
| Common Stock | 48,000,000 | — | 100.0% | $0.46Dec 2022 |
Sold to the crowd
- Reg CF · Sep 20194,056,007 shares at $0.40$1.6M· 2,071 investors
From the company's SEC filings: share counts per class, each class's voting and conversion terms, and the holders of 20% or more that Form C requires (officers and 10%+ holders on Form 1-A). Filings name only large holders, so most owners — including crowd investors — are not listed, and a holder's percentage may be of its own class rather than of the whole company. Prices and crowd share counts are in today's share terms — adjusted for splits and conversions since they were sold. Hover a figure for its filing.
Fundraising history
Team
8 people
Chris is a technology entrepreneur who has successfully developed and deployed advanced technology products and intellectual property over the past 30 years. He has worked as a consultant for Disney Imagineering and for leading automotive and technology companies. He is the inventor or co-inventor on 18 patents. He worked to develop the original concept for the HYDRA. His latest invention is our new "myTempie" ™ product for Remote Health Reporting and Access Control. Chris will continue to lead Liberty full time, including managing our new subsidiary, Liberty Health Technologies, and overseeing the development and marketing of our new "myTempie"™ product.

Michael Keane is a serial entrepreneur who has created a number of innovative web-based service startups including RealtyTrac, Inc ($50mm annual revenue). He has also led a number of technology development projects for clients like Castle Rock Entertainment, Sony, Bausch & Lomb and BAE Aerospace. Mr. Keane manages the development of the Liberty' Back Office suite of tools and reports along with the integration of the Back Office with a variety of utilities and other energy service product providers.

Timothy Hylas has over 35 years of accounting experience within the public and private sectors as controller for a diverse set of businesses ranging from non-profits to large mortgage companies, wine businesses and manufacturing companies of various sizes. Timothy brings a wealth of tax and accounting experience to these varied industries and acts as a trusted partner in their growth. In addition, Timothy has extensive experience in auditing for both small and large businesses.

Jay's work focuses on technology, law and business. He is a Professor and H. Ross and Helen Workman Research Scholar at the University of Illinois at Urbana-Champaign. He is also a practicing patent attorney for over 20 years.

Richard G. McKee, Jr. has been working in investment management and financial research for over forty years with a focus on small company value investing. He served as a director of Vyrex Corp. and helped transition the company into PowerVerde, Inc., a publicly traded company, developing green energy solutions. Richard is the founder and CEO of Dynamic Investment Group, an investment managing and consulting firm providing company analysis and venture capital assistance. Richard is a graduate of Brown University.
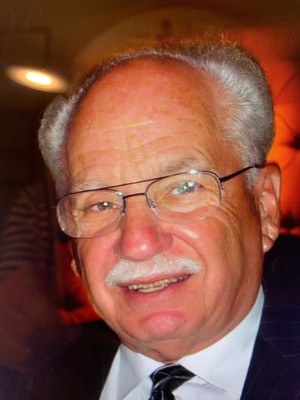
Mr. Leibowitz has forty-plus years of experience in design and development of advanced thermal power systems. As President of Waste Heat Solutions LLC, he advises clients making the transition from IR&D to commercial development. He has had a broad and varied background in industry, working for companies that include GE, UTC, Ormat, MTI, Exergy Inc. and PowerVerde. Mr. Leibowitz has a BSME from CCNY, an MSME from UConn and an MBA from RPI.

Richard (Rick) Davis has been employed in the investment banking space since 1982. In 2013 he became the CEO of publicly traded PowerVerde Inc., a renewable energy - to - power company. He has held corporate finance banking positions at First Equity Corp, William R. Hough & Co., RBC Daine Rausher. He has structured many private placements, merged companies and participated in many S - 1 registrations or IPO'S. He currently lives in Miami FL.
Names and titles as disclosed on SEC Form C, StartEngine. Bios and photos come from the platform campaign page and may be out of date.
Reg CF annual-report compliance
Filed 7 of 7 annual reports (FY2019–FY2025)
Reg CF issuers must file a Form C-AR each year until a Rule 202(b) termination trigger is met.
SEC filings
View all 30 filings on EDGAR- Form C-ARApr 30, 20260001775538-26-000001EDGAR
- Form C-ARMay 1, 20250001665160-25-000921EDGAR
- Form C-ARApr 22, 20240001665160-24-000422EDGAR
- Form C-ARMay 1, 20230001665160-23-001095EDGAR
- Form C-UOct 6, 20220001665160-22-002639EDGAR
- Form C-ARMay 2, 20220001665160-22-001342EDGAR
- Form C-UOct 29, 20210001665160-21-001927EDGAR
- Form C/AOct 12, 20210001665160-21-001796EDGAR
About this data. Figures are compiled from public sources — SEC EDGAR filings (Form C, C-AR, 1-A, 1-K) and funding-platform pages — and may be delayed, incomplete, or restated by the issuer. Financial statements are as reported by the issuer; each year is labeled with its assurance level (audited / reviewed / unaudited). A valuation cap is the conversion ceiling of a SAFE or convertible note, not an agreed company valuation; post-money figures are computed as pre-money plus amount raised and are not a traded price. Crowdonomics is not a broker-dealer, funding portal, or investment adviser; nothing here is investment advice or an offer to sell securities. Verify all figures against the linked EDGAR filings.