

MicroSilicon
OperatingMicroSilicon Inc.
Software & AI · Houston, TX · Founded 2015
Sensor technology for energy transformation
Financials
FY2020–FY2025 · from SEC filings · hover any figure for its sourceFigures as reported by the issuer in the filing shown on hover. Each year’s pill shows the assurance level of its filed statements — audited, reviewed (CPA review, less than an audit), or unaudited, as the filing’s own report or certification states it. A dashed pill marked * is inferred instead: the SEC minimum for an offering that size, which the issuer may have exceeded. No pill means we couldn’t tell. Headcount is the filing’s point-in-time count, not a year-end average. Manually corrected figures are marked “Corrected”.
Valuation over rounds
Pre-money — the valuation set before each round’s money came inBlue bars are the pre-money valuation the company stated for a priced round.
Share price over rounds
Disclosed sales come from the issuer's own filings (prior-offering lines, audited-statement notes) and are amount ÷ securities sold. A down round is a firm point more than 25 % below the previous firm point of the same share class on a comparable basis; the comparison ignores unverified and year-only lines.
Cap table
Share counts as of Apr 27, 2026| Class | Outstanding | Votes / share | Share of total | Last price |
|---|---|---|---|---|
| Common Stock | 3,575,234 | 1 | 100.0% | $5.20Jul 2022 |
Principal holders% as the filing states it, Apr 27, 2026
- Tembusu LLC1,065,563 Common Stock29.8%of company
- Aydin Babakhani1,000,000 Common Stock28.0%of company
- Everyone else (not named in filings)42.2%
Sold to the crowd
- Reg CF · Jul 202235,297 shares at $5.20$183.5K· 144 investors
From the company's SEC filings: share counts per class, each class's voting and conversion terms, and the holders of 20% or more that Form C requires (officers and 10%+ holders on Form 1-A). Filings name only large holders, so most owners — including crowd investors — are not listed, and a holder's percentage may be of its own class rather than of the whole company. Prices and crowd share counts are in today's share terms — adjusted for splits and conversions since they were sold. Hover a figure for its filing.
Fundraising history
Team
7 people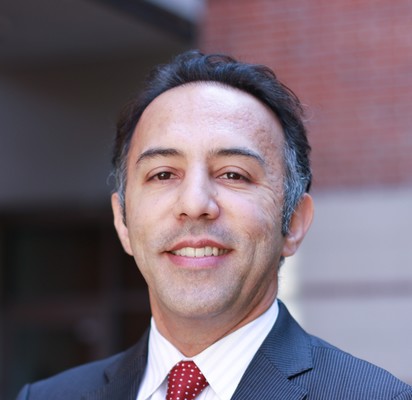
Dr. Babakhani is an Associate Professor in the Electrical and Computer Engineering Department at UCLA and the Director of UCLA Integrated Sensors Laboratory. Prior to joining UCLA, he was an Associate Professor in the Electrical and Computer Engineering Department at Rice University and the Director of Rice Integrated Systems and Circuits Laboratory. He was a Louis Owen Junior Chair Assistant Professor (2016-2017) and Assistant Professor of ECE (2011-2016) at Rice University. He was a member of DARPA Microsystems Exploratory Council (MEC) from 2017-2021. He is a co-founder of MicroSilicon Inc., Maxwell Biomedical Inc. and Nerovnik Inc. He received his B.S. degree in electrical engineering from Sharif University of Technology in 2003 and his M.S. and Ph.D. degrees in Electrical Engineering from Caltech in 2005 and 2008, respectively. He was a postdoctoral scholar at Caltech in 2009 and a research scientist at IBM Thomas J. Watson Research Center in 2010. Aydin works Part time & 4 hours / week at Microsilicon.
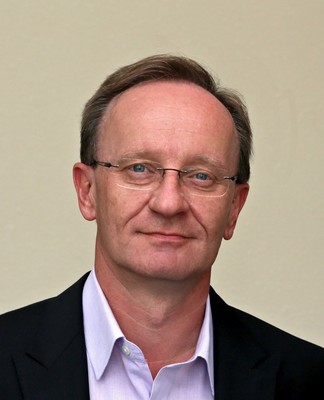
Omar is a thirty-year veteran of the Oil and Gas industry. Omar is co-founder and CEO of MicroSilicon Inc. and previously co-founder and former CEO of RigNet (NASDAQ: RNET) where he gained knowledge and experience building a technology business within Oil & Gas industry from the ground up. He has spent his career in different parts of the globe including the US, Europe, Asia-Pacific and the Middle East, establishing and growing successful teams. The first half of his career was with Schlumberger were he progressed from the field to various leadership positions. Omar brings a deep understanding of the global Oil & Gas industry with great understanding of cultural differences, operating conditions and business dynamics around the world. Mr. Kulbrandstad holds a degree in Electrical Engineering, Electronics from Trondheim School of Technology in Norway. Omar is fulltime at Microsilicon.

What I've enjoyed most in my career have been the opportunities to take simple ideas in physics and create new business opportunities. If there's a differential equation to be solved, so much the better! Over the past 20yrs, I have created technology and markets for: real-time LWD imaging, electromagnetic MWD telemetry, optically enabled Coiled Tubing and real-time sandface monitoring on Dual Stage subsea completions. Now focusing on techniques to better extract valuable production and reservoir information from permanent microwave, electrical and optical sensing, with particular emphasis on production management and flow assurance. John is Full time & works 40 hours a week at Microsilicon.
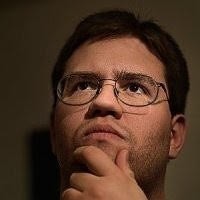
I am an electronics engineer with fifteen years of experience in firmware development, mixed-signal systems, low-level communications, and IoT. My particular specialty is in understanding and developing complex systems. I am also an excellent communicator, and use my skills for training and collaborative work. I have a record of both leading and assisting in long-term investigations to uncover the root causes of technical problems. I've kept up my math and science learning since college, which helps me to quickly learn new technical skills.
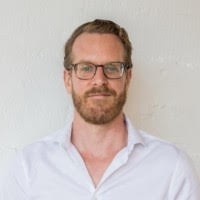
Fintech executive with extensive experience in capital markets. Co-founder and Chief Investment Officer of Treasure a Fintech company providing outsourced treasury and CFO operation for small and medium businesses. Worked for 10 years for Peter Thiel family office and hedge fund (Clarium) as a portfolio manager and macro strategist helping Peter deploy capital across the world. Subsequently launched and successfully ran his own family office leveraging the experience gained with Thiel. Ben is Part time & works 1 hour / week.
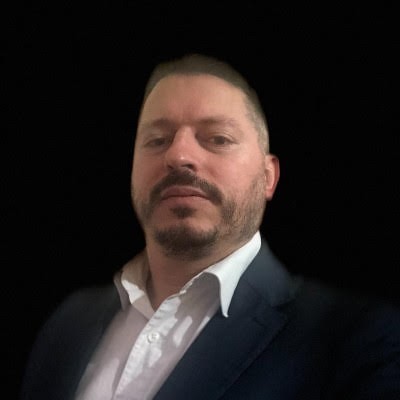
Technically sophisticated engineering professional with solid history of production optimization, surface facilities and field operations in the Oil and Gas industry. • Broad knowledge and success in an engineering development environment, to include reservoir characterization and geological modeling of conventional and unconventional plays. • Success developing, executing, and analyzing project designs, production monitoring, production optimization, artificial lift systems, basic reservoir analysis, and surveillance. • Skilled team leader and trainer with a track record of directing multiple tasks effectively to ensure on target completion of all deliverables; engineering design, and process improvement. • Outstanding interpersonal and communication strengths leveraged to understand and drive continuous performance improvement in well productivity, cost efficiency, well sequencing, and overall strategy. John is Full time & works 40 hours a week at Microsilicon.
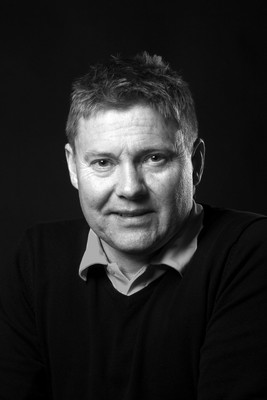
Experienced Chief Executive Officer with a demonstrated track record in the oil & energy industry. Strong subsurface knowlegde background including reservoir, drilling & completions. Skilled in Management, and Organizational Leadership. Skilled business development professional with a MSc in Petroleum Engineering from Rogaland University. Torger is Part time & works 1 hour / week at Microsilicon
Names and titles as disclosed on SEC Form C, StartEngine. Bios and photos come from the platform campaign page and may be out of date.
Reg CF annual-report compliance
Filed 4 of 4 annual reports (FY2022–FY2025)
Reg CF issuers must file a Form C-AR each year until a Rule 202(b) termination trigger is met.
SEC filings
View all 12 filings on EDGAR- Form C-ARApr 27, 20260001676516-26-000002EDGAR
- Form C-ARMay 12, 20250001665160-25-001077EDGAR
- Form C-ARApr 30, 20240001665160-24-000662EDGAR
- Form C-ARApr 26, 20230001665160-23-000804EDGAR
- Form C-UFeb 8, 20230001665160-23-000197EDGAR
- Form C/ADec 5, 20220001665160-22-003022EDGAR
- Form C/ANov 4, 20220001665160-22-002870EDGAR
- Form CJul 25, 20220001665160-22-002088EDGAR
About this data. Figures are compiled from public sources — SEC EDGAR filings (Form C, C-AR, 1-A, 1-K) and funding-platform pages — and may be delayed, incomplete, or restated by the issuer. Financial statements are as reported by the issuer; each year is labeled with its assurance level (audited / reviewed / unaudited). A valuation cap is the conversion ceiling of a SAFE or convertible note, not an agreed company valuation; post-money figures are computed as pre-money plus amount raised and are not a traded price. Crowdonomics is not a broker-dealer, funding portal, or investment adviser; nothing here is investment advice or an offer to sell securities. Verify all figures against the linked EDGAR filings.