

NetObjex
OperatingNetObjex, Inc
Software & AI · Irvine, CA
Financials
FY2015–FY2019 · from SEC filings · hover any figure for its sourceFigures as reported by the issuer in the filing shown on hover. Each year’s pill shows the assurance level of its filed statements — audited, reviewed (CPA review, less than an audit), or unaudited, as the filing’s own report or certification states it. A dashed pill marked * is inferred instead: the SEC minimum for an offering that size, which the issuer may have exceeded. No pill means we couldn’t tell. Headcount is the filing’s point-in-time count, not a year-end average. Manually corrected figures are marked “Corrected”.
Valuation over rounds
Pre-money — the valuation set before each round’s money came inBlue bars are the pre-money valuation the company stated for a priced round.
Share price over rounds
Disclosed sales come from the issuer's own filings (prior-offering lines, audited-statement notes) and are amount ÷ securities sold. A down round is a firm point more than 25 % below the previous firm point of the same share class on a comparable basis; the comparison ignores unverified and year-only lines.
Cap table
Share counts as of Dec 31, 2017| Class | Outstanding | Votes / share | Share of total | Last price |
|---|---|---|---|---|
| Common stock | 44,968,840 | — | 100.0% | — |
Shares outstanding over timein today's share terms
Sold to the crowd
- Reg CF · Jan 2018711,302 shares at $0.15$106.7K· 195 investors
- Reg CF · Nov 2018167,463 Series B Nonvoting Common Stock at $0.15$25.1K· 29 investors
From the company's SEC filings: share counts per class, each class's voting and conversion terms, and the holders of 20% or more that Form C requires (officers and 10%+ holders on Form 1-A). Filings name only large holders, so most owners — including crowd investors — are not listed, and a holder's percentage may be of its own class rather than of the whole company. Prices and crowd share counts are in today's share terms — adjusted for splits and conversions since they were sold. Hover a figure for its filing.
Fundraising history
Team
17 people
NetObjex CEO Raghu Bala was previously an executive with Yahoo, Infospace, PwC, and with 3 successful startup exits. He also teaches MIT Sloan School of Business/Computer Science and AI Laboratory’s course on the Implications of Artificial Intelligence on Business, as well is a Tutor for MIT's Blockchain course. Mr. Bala was winner of 2016 Best Abstract in Best Wearable Medical Device category at the AI in Medicine conference, and in 1993 winner of the Best Thesis Award on Temporal Databases at the Hartford Graduate Center Conference. He holds an MBA in Finance from Wharton MBA, an MS in Computer Science from RPI, has been a Columbia University Adjunct Lecturer, published author (Microsoft Press, Macmillan) and speaker at several major conferences including IoT Congress, Google IO, and more. Source Interlink Media Aug 1, 2006 - Apr 30, 2014, CTO Various Clients May 1 2014 - Jan 20 2017, Technical Consultant NetObjex Inc, Jan 21 2017-Present, CEO

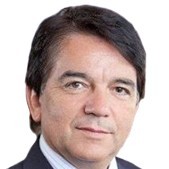






Show 8 more peopleShow fewer

Ex CTO of Broadcom




Team Member of NetObjex

2015-present NetObjex as a Member of Board of Directors 2013-15 President of Castlerock Holdings LLC 2010-2013 President of Fanggle


Names and titles as disclosed on SEC Form C, StartEngine. Bios and photos come from the platform campaign page and may be out of date.
Reg CF annual-report compliance
Filed 2 of 9 annual reports (FY2017–FY2025)
Reg CF issuers must file a Form C-AR each year until a Rule 202(b) termination trigger is met.
SEC filings
View all 10 filings on EDGAR- Form C-TRJun 12, 20200001665160-20-000805EDGAR
- Form C-ARFeb 19, 20200001665160-20-000136EDGAR
- Form C-UAug 23, 20190001665160-19-000877EDGAR
- Form C-UAug 23, 20190001665160-19-000876EDGAR
- Form C-ARApr 25, 20190001665160-19-000407EDGAR
- Form C-UFeb 15, 20190001665160-19-000198EDGAR
- Form CNov 14, 20180001665160-18-001219EDGAR
- Form C-USep 6, 20180001665160-18-000895EDGAR
About this data. Figures are compiled from public sources — SEC EDGAR filings (Form C, C-AR, 1-A, 1-K) and funding-platform pages — and may be delayed, incomplete, or restated by the issuer. Financial statements are as reported by the issuer; each year is labeled with its assurance level (audited / reviewed / unaudited). A valuation cap is the conversion ceiling of a SAFE or convertible note, not an agreed company valuation; post-money figures are computed as pre-money plus amount raised and are not a traded price. Crowdonomics is not a broker-dealer, funding portal, or investment adviser; nothing here is investment advice or an offer to sell securities. Verify all figures against the linked EDGAR filings.