

PittMoss
OperatingPittMoss LLC
Energy & Cleantech · Cleantech · Ambridge, PA · Founded 2015
A revolutionary new growing media
Financials
FY2018–FY2026 · from SEC filings · hover any figure for its sourceChart shows the most recent 8 fiscal years; 1 earlier year is in the table below.
Figures as reported by the issuer in the filing shown on hover. Each year’s pill shows the assurance level of its filed statements — audited, reviewed (CPA review, less than an audit), or unaudited, as the filing’s own report or certification states it. A dashed pill marked * is inferred instead: the SEC minimum for an offering that size, which the issuer may have exceeded. No pill means we couldn’t tell. Headcount is the filing’s point-in-time count, not a year-end average. Manually corrected figures are marked “Corrected”.
Valuation over rounds
Valuation caps on SAFE / convertible note roundsDashed amber bars are a SAFE or convertible note's valuation cap — the most it converts at, not what the company is worth.
Share price over rounds
Disclosed sales come from the issuer's own filings (prior-offering lines, audited-statement notes) and are amount ÷ securities sold. A down round is a firm point more than 25 % below the previous firm point of the same share class on a comparable basis; the comparison ignores unverified and year-only lines.
Cap table
Principal holders% as the filing states it, Nov 28, 2023
- BT PittMoss Investment, LP13,155,353 Preferred Units—of votes
Sold to the crowd
- Reg CF · May 2020Crowd SAFE$240.5K· 1,072 investors
- Reg CF · Mar 2021Crowd SAFE$481.5K· 1,433 investors
- Reg CF · Mar 2023Preferred Units$115.8K· 310 investors
From the company's SEC filings: share counts per class, each class's voting and conversion terms, and the holders of 20% or more that Form C requires (officers and 10%+ holders on Form 1-A). Filings name only large holders, so most owners — including crowd investors — are not listed, and a holder's percentage may be of its own class rather than of the whole company. Prices and crowd share counts are in today's share terms — adjusted for splits and conversions since they were sold. Hover a figure for its filing.
Fundraising history
Team
13 people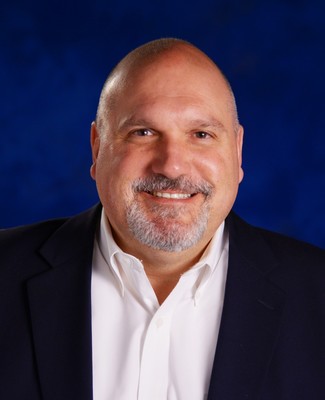
Brian Scott is the President and CEO of Pittmoss, a company that creates sustainable, organic soils made from recycled paper and cardboard. He was also founder and CEO of Express Management Group and an adjunct faculty member at Gannon University. Mr Scott began his career as the Chief Information Officer and Director of Acquisitions at Rentway, which went public on the NYSE during his tenure and exited with a sale in 2006. He has served on many for-profit and non-profit boards including Aurochs Brewing, The Flagship Niagara League, and the Innovation Collaborative and was the founder and chairman of Tall Ships Erie. Mr. Scott earned his undergraduate degree from the Pennsylvania State University and his master’s degree in software engineering from Gannon University. He has also been a business mentor with the Erie Technology Incubator and continues to mentor entrepreneurs as an angel investor with BlueTree Allied Angels, one of the most active angel groups in the Mid-Atlantic region of the US.

Dr.Bethke has had an interest in soils since conducting his first soil research in his father’s Greenhouse in western Michigan. With this interest, Dr. Bethke attended Michigan State University served as a student teaching assistant while receiving his bachelor's degree in soil science. He went on to the University of Missouri and received a master's degree focusing on soil fertility and nutrient buffering. Dr. Bethke returned to the family farm that focused on Greenhouse production and vegetable farming. During that time, he conducted a radio show on gardening. After about five years he attended Michigan State University and obtained a doctorate in plant physiology, as well as coordinated the research Greenhouse facility with over 70 researchers. Dr. Bethke then became technical director for Michigan Peat Company, the largest peat company in the United States and he served as research granting coordinator for the Bedding Plant Foundation. After 13 years, Dr. Bethke became a consultant serving Companies and Growers in the greenhouse and growing substrates industry. In 2014, he began working with PittMoss LLC as the technical director working on formulation of growing substrates. The work was performed with a focus on environmental stewardship, recycling products and sustainable materials. Currently his focus is highly dedicated to regenerative agriculture and wise use of resources. He won’t admit it himself, but Dr.Bethke is highly regarded as one of the top 5 soil scientists in his field.
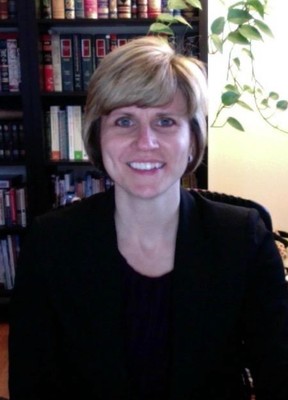
Amber has 20+ years of experience leading the finance departments for companies of all sizes and across various industries. She has an MBA, is a PA attorney and is passionate about helping companies grow and prosper. She began her own firm, Finacctic to help entrepreneurs and business leaders achieve their dreams by providing value-add accounting and finance services critical to managing, analyzing, and growing a business. Amber has been with PittMoss for over six years, as our contract CFO and General Counsel.

With over 10 years of startup management experience, Ashley Mariani is passionate about her role in growing PittMoss. While receiving her MBA and MA in Mass Communications and Journalism, Ashley began her career at the Mayor’s Office for the City of Pittsburgh and then joined a fast-growing SaaS-based software startup, Industry Weapon (acquired by Spectrio). While overseeing their marketing department, Ashley was introduced to PittMoss in 2016 and joined to help launch e-commerce and marketing functions. The role quickly grew, and Ashley is involved in many aspects of the business - supervising marketing, assisting with sales strategy and reporting, process improvement and development to software implementation, employee onboarding, factory tours, community engagement, garden club presentations and more. As the Director of Business Development, Ashley takes her broad experience and leadership skills wherever she is needed to help grow the business.

Mark Goldman has spent his life in the horticulture industry and brings 40+ years of industry experience to PittMoss. Spending 20+ years at Brighton By-Products, a regional horticultural supply company in various marketing and sales capacities, Mr. Goldman’s role grew to becoming Vice President and oversaw the sale of the company during a period of industry acquisition. Mr. Goldman then became VP at Therm-O-Rock where he led and restructured a manufacturing product line producing peat mixes using innovative materials such as rock wool. After being introduced to PittMoss, Mr. Goldman joined the team in 2014 and has led our sales efforts, utilizing his extensive industry experience and network to establish PittMoss as a legitimate alternative to commercial peat use. After all this time, you will still find Mr. Goldman making his way across the country enthusiastically pitching PittMoss to every greenhouse or farm and making sure every potential customer who passes our trade show booth knows about our products. In addition to PittMoss, Mr. Goldman also serves as a strategic advisor to Aquarius Power Co.
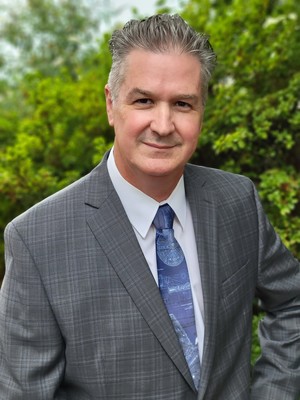
The most recent member to join the team, Rich brings over 30 years of experience in process improvement spanning several industries, beginning as a lean application specialist for WESCO distribution to Plant Manager for PH Tech Organization. Rich earned his B.S. in Industrial Management along with his M.B.A and holds a Lean Six Sigma Black Belt Certification. Rich will oversee the growth of PittMoss’ production capabilities and bring his strong track record of organizational management to build out our ever-growing production teams.

Robert is thrilled to join PittMoss as he sees the potential for the material to replace Peat Moss in various trades, benefiting the environment. With a track record of team-building and exceptional customer service, he is confident in PittMoss's future, which he believes is both sustainable and poised to become organically certified. His focus will be on growing the business through relationships with lawn and garden retailers, consumer package providers, and commercial growers, leveraging his current network and expanding partnerships.

Rob was an early team member at PittMoss, growing out of e-commerce and into a sales role to support our wholesale and commercial efforts. Today, Rob has over 5 years of industry sales experience, quickly proving himself as a go-to rep for many of our high-valued accounts. Rob’s knowledge of PittMoss and the unique nature of the industry has provided Rob with an incredible breadth of experience that he brings to our growing sales channels. Rob’s role has also grown to oversee the development of our new sales interns, mentoring them through their first year on-the-ground. Rob earned his MBA after completing his B.S in Information Management Systems and has previous experience as an SEO coordinator for Dicks Sporting Goods.
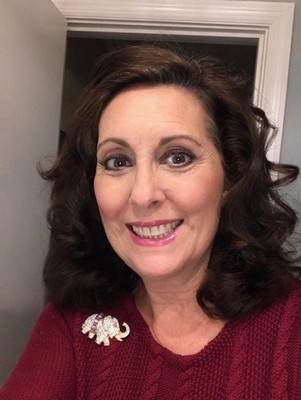
Donna Pavlis has 39+ years of experience in design and marketing and an MA in Communications. She is owner/chief marketing strategist for SG&D Communications and Side Porch Creative. With her own agency, Donna worked with clients, including the Buncher Company, ALOCOSAN, Allegheny County and Keystone Manufacturing. Donna joined PittMoss close to four years ago in a part-time capacity to help oversee important marketing functions, such as point-of-purchase design, budgeting, trade-show management, PR requests, social media and brand management. Donna also sits on the board of the Sewickley Music Club and Sewickley Cemetery Foundation.
Show 4 more peopleShow fewer
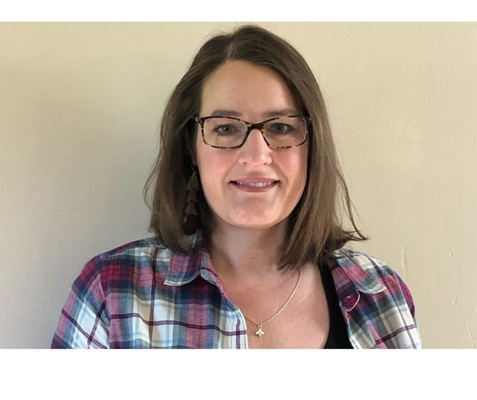
With a degree in Wildlife & Fisheries Sciences, an M.S. Sustainable Systems Sciences and a former PSCE Master Gardener project coordinator, Mary brings an incredible amount of technical knowledge and lived experience to PittMoss. From her work in research and sustainability at both Slippery Rock University and California University of PA, Mary arrived at PittMoss in 2019, where she coordinates our QA and R&D at our facility in Ambridge and applies for and facilitates work for our grants. Mary’s technical experience, on top of living on a homestead with chickens and horses, provides PittMoss with meaningful real-world know-how, along with ample testing resources and application research.
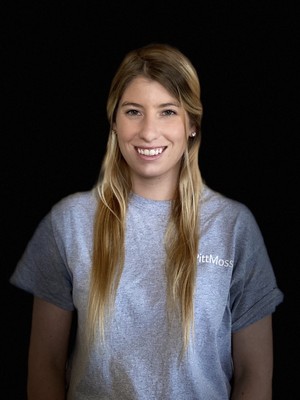
Rachel Szelc started as an intern while completing her B.A. in Accounting, with minors in Supply Chain and Project Management. She quickly proved PittMoss needed her full-time and came on board after graduation. Rachel has spent the past 4 years managing the day-to-day operations between sales and production. As the Operations Manager, Rachel helps coordinate orders, assists with AP/AR/payroll and general bookkeeping, as well as maintaining sales and shipment reports. Rachel also assists the production team with inventory management, purchase orders, costing and controls. To top that off, Rachel also works closely with QA, R&D, and in-house testing. Rachel organizational skills keep operations in order and her deep knowledge of the operational functions at PittMoss HQ is invaluable.
Names and titles as disclosed on SEC Form C, StartEngine. Bios and photos come from the platform campaign page and may be out of date.
Reg CF annual-report compliance
Filed 6 of 6 annual reports (FY2020–FY2025)
Reg CF issuers must file a Form C-AR each year until a Rule 202(b) termination trigger is met.
SEC filings
View all 40 filings on EDGAR- Form DSep 25, 20260001634025-26-000004EDGAR
- Form D/ASep 25, 20260001634025-26-000003EDGAR
- Form C-ARApr 17, 20260001634025-26-000001EDGAR
- Form C-AR/AApr 17, 20260001634025-26-000002EDGAR
- Form DDec 16, 20250001634025-25-000006EDGAR
- Form D/ADec 16, 20250001634025-25-000005EDGAR
- Form D/ASep 18, 20250001634025-25-000003EDGAR
- Form DSep 18, 20250001634025-25-000004EDGAR
About this data. Figures are compiled from public sources — SEC EDGAR filings (Form C, C-AR, 1-A, 1-K) and funding-platform pages — and may be delayed, incomplete, or restated by the issuer. Financial statements are as reported by the issuer; each year is labeled with its assurance level (audited / reviewed / unaudited). A valuation cap is the conversion ceiling of a SAFE or convertible note, not an agreed company valuation; post-money figures are computed as pre-money plus amount raised and are not a traded price. Crowdonomics is not a broker-dealer, funding portal, or investment adviser; nothing here is investment advice or an offer to sell securities. Verify all figures against the linked EDGAR filings.