
Rayton
OperatingRayton Solar Inc.
Energy & Cleantech · Van Nuys, CA
Evolving the Semiconductor Industry
Financials
FY2015–FY2023 · from SEC filings · hover any figure for its sourceChart shows the most recent 8 fiscal years; 1 earlier year is in the table below.
Figures as reported by the issuer in the filing shown on hover. Each year’s pill shows the assurance level of its filed statements — audited, reviewed (CPA review, less than an audit), or unaudited, as the filing’s own report or certification states it. A dashed pill marked * is inferred instead: the SEC minimum for an offering that size, which the issuer may have exceeded. No pill means we couldn’t tell. Headcount is the filing’s point-in-time count, not a year-end average. Manually corrected figures are marked “Corrected”.
Valuation over rounds
Pre-money — the valuation set before each round’s money came inBlue bars are the pre-money valuation the company stated for a priced round. Dotted grey bars are our estimate for rounds that didn't state one: the round's share price × the shares outstanding in its filings. Same measure as blue, but rougher. Dashed amber bars are a SAFE or convertible note's valuation cap — the most it converts at, not what the company is worth, so don't compare them with the other bars.
Share price over rounds
Disclosed sales come from the issuer's own filings (prior-offering lines, audited-statement notes) and are amount ÷ securities sold. A down round is a firm point more than 25 % below the previous firm point of the same share class on a comparable basis; the comparison ignores unverified and year-only lines.
Cap table
Share counts as of Dec 31, 2023| Class | Outstanding | Votes / share | Share of total | Liquidation | Last price |
|---|---|---|---|---|---|
| Preferred Stockpreferred | 1,163,817 | — | 0.75% | 1× non-participating · paid 1st | — |
| Series Seed 2 Preferred Stockpreferred | 328,333 | — | 0.21% | 1× | $0.35Mar 2023 |
| Common Stock | 153,607,816 | 1 | 99.0% | — | $1.52Dec 2018 |
| Total | 155,099,966 | 100% |
Shares outstanding over timein today's share terms
Principal holders% as the filing states it, Aug 13, 2024
- Andrew Yakub80,500,000 Common Stock51.9%of
- Marooned, Inc.30,523,432 Common Stock19.9%of
- Robert Julian0 Common Stock—of votes
Sold to the crowd
- Reg A+ · Nov 20163,552,632 Common Stock at $1.52$5.4M
- Reg CF · Apr 2019$37.3K· 29 investors
- Reg CF · Jul 2019Common Stock$1.1M· 1,619 investors
- Reg CF · Sep 20205,948,677 shares at $0.33$2M· 1,956 investors
- Reg CF · Feb 20214,949,070 shares at $0.33$1.6M
- Reg CF · Sep 2022328,386 shares at $0.35$114.9K· 118 investors
- Reg CF · Mar 20231,934,423 shares at $0.35$677K· 604 investors
From the company's SEC filings: share counts per class, each class's voting and conversion terms, and the holders of 20% or more that Form C requires (officers and 10%+ holders on Form 1-A). Filings name only large holders, so most owners — including crowd investors — are not listed, and a holder's percentage may be of its own class rather than of the whole company. Prices and crowd share counts are in today's share terms — adjusted for splits and conversions since they were sold. Hover a figure for its filing.
Fundraising history
Team
12 people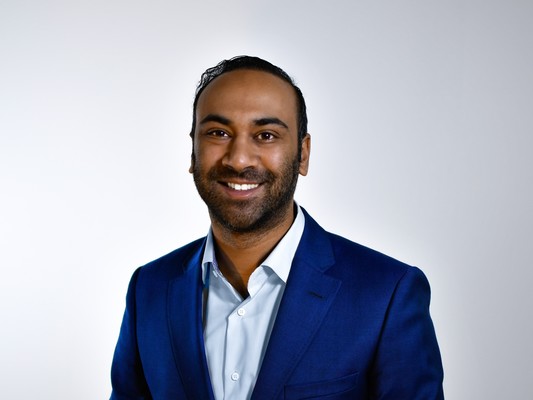
Andrew Yakub is the founder of the Company and has served as its Chief Executive Officer and Chairman of the Board of Directors since October 2013. Prior to Rayton, in September 2009 Andrew founded and has since acted as the Chief Executive Officer of ReGen America, Inc. a producer of commercial and residential solar photovoltaic systems. In that position, he was responsible for the development of over 6 megawatts of solar installations. Named to Forbes’ “30 under 30” list in 2016, Mr. Yakub is a two time clean technology entrepreneur. Mr. Yakub’s experience spans from UCLA’s Particle Beam Physics Lab to NASA’s Jet Propulsion Lab. He holds a Bachelor’s in Physics from UC Santa Barbara.
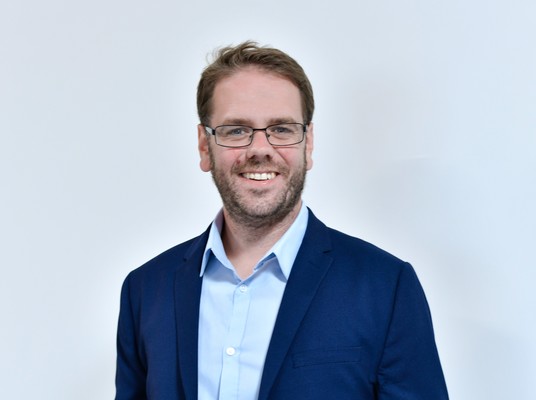
Dr. Joshua McNeur is the Accelerator and Design Engineer who leads the operation and characterization of Rayton's unique high current ion source. He received his Ph.D. from UCLA, with his research focused on accelerator and charged beam physics. He has over 10 years of experience in designing, characterizing and operating various forms of particle accelerators.
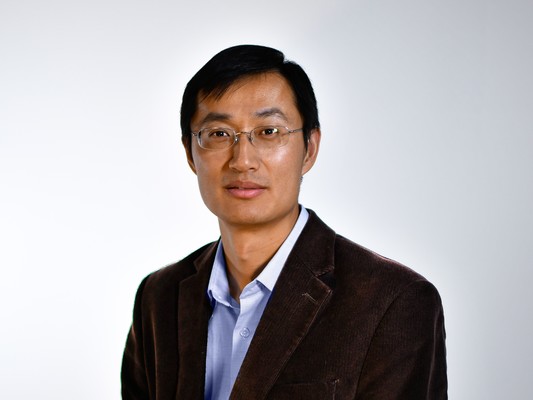
Dr. Liu has over 10 years of R&D experience in the solar industry. Prior to Rayton he was the Director of Product Engineering at Arzon Solar (a concentrator photovoltaic technology company) where he led the team to break the world record of solar module efficiency two times. He also has extensive experience in prototyping and manufacturing ramp-up. He obtained his M.S. and Ph.D. in Electrical Engineering from University of Texas at Austin and the University of Virginia.
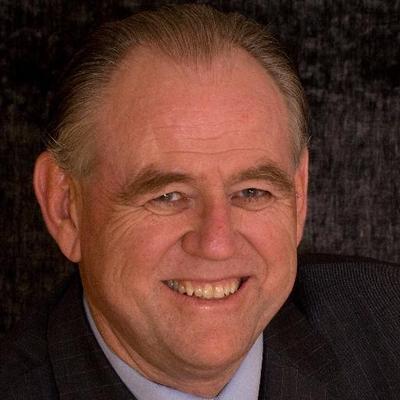
Carl Nettleton heads Nettleton Strategies, a firm specializing in forming complex community coalitions and handling high profile issues involving government, media, business, and neighborhoods. The firm provides critical insight and strategic problem solving for both old and new issues. He serves on the national and California advisory councils for Environmental Entrepreneurs (E2), a national, nonpartisan group of business owners, investors and others who advocate for policies that are good for the economy and good for the environment. Carl also founded OpenOceans Global, an NGO linking people to the world’s oceans. His subject matter expertise includes oceans, all things water, energy, climate, and U.S./Mexico border issues.
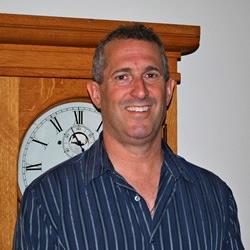
Dr. James Rosenzweig is a UCLA professor, former UCLA Physics and Astronomy Department Chair, and a world-renowned researcher in particle beams with over 500 scientific publications. He has been named a Fellow of the American Physical Society and was awarded the International Free-electron Laser Prize. His expertise in particle beam physics is extremely valuable to the development of the ion-cutting process and high-current proton implanter.
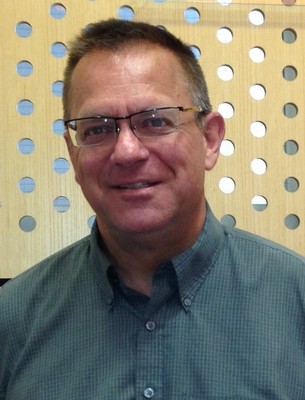
Dr. Mark Goorsky is a UCLA professor, former UCLA Materials Science Chair, and Rayton’s resident expert in ion implantation, layer transfer, wafer bonding and material integration. Dr. Goorsky received his Ph.D. in Materials Science and Engineering from MIT and continued his postdoctoral fellowship at the IBM T.J. Watson Research Center. Dr. Goorsky’s expertise in materials science and wafer bonding is incredibly crucial to the development of Rayton’s ion-cutting process.
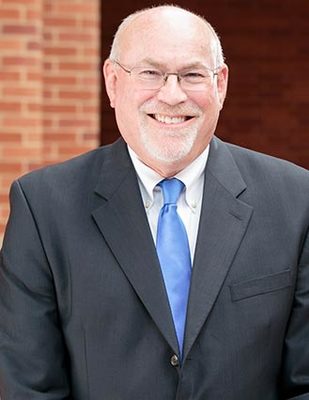
Jeffrey Scheinrock is a distinguished serial entrepreneur lending his talents to Rayton in its investment stage. Jeffrey is the CFO of Originate and the Faculty Director of the Applied Management Research Program and Continuing Lecturer at UCLA Anderson School of Business.

Joshua Rossman is a Senior Executive with deep expertise in customer loyalty, analytics and insights with large, Fortune 1000 companies as well as early to mid-stage start-ups. He possesses a strong track record of delivering data-driven business results across large, complex organizations that increase revenue, improve the customer experience, and better align organizational needs. He is a proven and effective leader who is adept at consensus building, influencing, and leading large cross-functional teams through customer-centric culture change.
Show 3 more peopleShow fewer
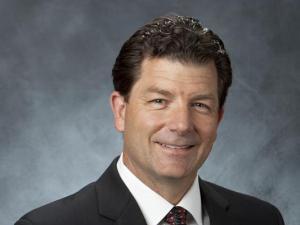
Michael was the Executive Vice President and third-generation owner of Wilbur Curtis Co., Inc., a 75-year-old foodservice equipment manufacturing company. He is also the Founder, President and owner of World-Wide Advantage, a global sourcing company, and the executive advisory board member for Prime Advantage, a Group Purchasing Organization focused on improving cost considerations for manufacturers. He also is a strategic advisor with North American Foodservice Equipment Manufacturers (NAFEM) and Food Equipment Manufacturers Association (FEMA).
Names and titles as disclosed on SEC Form 1-A, StartEngine, SEC Form C. Bios and photos come from the platform campaign page and may be out of date.
Reg CF annual-report compliance
Filed 5 of 7 annual reports (FY2019–FY2025)
Reg CF issuers must file a Form C-AR each year until a Rule 202(b) termination trigger is met.
SEC filings
View all 59 filings on EDGAR- Form CAug 13, 20240001104659-24-088574EDGAR
- Form C-ARAug 9, 20240001104659-24-087481EDGAR
- Form 1-UMay 13, 20240001104659-24-060411EDGAR
- Form 1-UApr 29, 20240001104659-24-053619EDGAR
- Form 1-SASep 27, 20230001104659-23-104010EDGAR
- Form 1-KMay 1, 20230001104659-23-054032EDGAR
- Form C-ARMay 1, 20230001644600-23-000086EDGAR
- Form C/AApr 27, 20230001670254-23-000444EDGAR
About this data. Figures are compiled from public sources — SEC EDGAR filings (Form C, C-AR, 1-A, 1-K) and funding-platform pages — and may be delayed, incomplete, or restated by the issuer. Financial statements are as reported by the issuer; each year is labeled with its assurance level (audited / reviewed / unaudited). A valuation cap is the conversion ceiling of a SAFE or convertible note, not an agreed company valuation; post-money figures are computed as pre-money plus amount raised and are not a traded price. Crowdonomics is not a broker-dealer, funding portal, or investment adviser; nothing here is investment advice or an offer to sell securities. Verify all figures against the linked EDGAR filings.