
Saebo
OperatingSAEBO Inc
Biotech · Charlotte, NC · Founded 2004
Leaders in Home Stroke Recovery
Financials
FY2018–FY2023 · from SEC filings · hover any figure for its sourceFigures as reported by the issuer in the filing shown on hover. Each year’s pill shows the assurance level of its filed statements — audited, reviewed (CPA review, less than an audit), or unaudited, as the filing’s own report or certification states it. A dashed pill marked * is inferred instead: the SEC minimum for an offering that size, which the issuer may have exceeded. No pill means we couldn’t tell. Headcount is the filing’s point-in-time count, not a year-end average. Manually corrected figures are marked “Corrected”.
Valuation over rounds
Pre-money — the valuation set before each round’s money came inBlue bars are the pre-money valuation the company stated for a priced round.
Cap table
Share counts as of Dec 31, 2019| Class | Outstanding | Votes / share | Share of total | Last price |
|---|---|---|---|---|
| Preferred Stockpreferred | 12,137,337 | — | 100.0% | — |
Sold to the crowd
- Reg CF · Jan 20211,110,843 shares at $0.50$555.4K· 822 investors
From the company's SEC filings: share counts per class, each class's voting and conversion terms, and the holders of 20% or more that Form C requires (officers and 10%+ holders on Form 1-A). Filings name only large holders, so most owners — including crowd investors — are not listed, and a holder's percentage may be of its own class rather than of the whole company. Prices and crowd share counts are in today's share terms — adjusted for splits and conversions since they were sold. Hover a figure for its filing.
Fundraising history
Team
10 people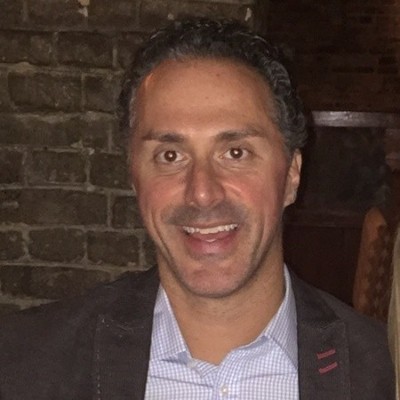
Most known for co-creating the revolutionary SaeboFlex exoskeleton for stroke recovery which is currently on permanent display at the London Museum of Science, Henry holds 17 patents with products that have helped tens of thousands of patients regain function. As an occupational therapist, Henry has worked in a variety of clinical settings including home health, acute, sub-acute, and outpatient rehab. Prior to leaving Burke Rehabilitation Hospital in New York in 2002, he worked as a clinical specialist in stroke and orthopedic medicine and manual therapy of the upper quadrant. After leaving Burke, Henry co-founded Saebo, with the goal of creating innovative and life-changing solutions for the physically impaired population. He currently holds 17 patents with products that have helped tens of thousands of clients regain function. Saebo's name is an acronym for Henry’s grandmother "Sarah Eileen Booth". Her entire life was dedicated to providing a hand to others in need. Saebo’s mission is to match her spirit, dedication, and desire to help others.

Pete had a successful early corporate career at companies like Kimberly Clark, Eaton and General Electric, and after working in several startups, he was inspired to start RivalHealth in 2009, a company delivering fully customized and individual fitness solutions. In 2017, after changing thousands of people’s lives, he merged the company with gBehavior to form GoPivot Solutions, the leading well-being platform in the US. Pete went on to form Cruxible Partners, a boutique consulting and talent acquisition firm in 2018. After consulting with Saebo, Inc. he joined the company as CEO in early 2022. Pete was excited to marry his passion for health and Saebo’s mission to leave no stroke patient behind. He is patent holder, a podcast host, an accomplished triathlete, exercise junkie, nutrition nut and NASM Certified Personal Trainer (CPT). Pete holds a BS in Industrial Engineering and MBA and is a former Ernst & Young Entrepreneur of the Year for the Carolinas.
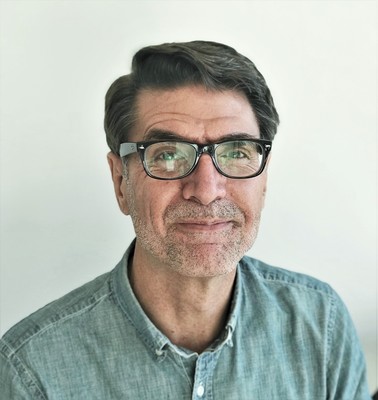
With executive roles in finance, operations, and marketing, Chris has over 30 years of experience in the healthcare, direct-to-consumer, and retail markets. With a passion for early-stage companies, Chris joined Saebo in its first year of operations and has enjoyed overseeing the back-office, warehouse and distribution operations, while also directing the reimbursement, compliance, and marketing strategies as Saebo's full-time COO. Prior to joining Saebo, Chris built his experience in the healthcare sector as Director of Mergers and Acquisitions for CHMG Capital. Chris received his BA in Economics from Davidson College.
Finance executive with 35 years of experience in auditing and in financial operations of growing health care companies. Alan's areas of expertise include financial reporting, cash flow management, risk management, and human resources. Alan began his career in public accounting with Peat Marwick & Mitchell (now KPMG) where he advanced his career to the manager level while successfully passing the CPA exam. He worked for a growing Durable Medical Equipment and Home IV therapy company as Receivables Management Director. He then was Controller of a multi-location nursing home company with responsibility for most areas of the financial operations and reporting. For the last 19 years, Alan has worked for CHMG Solutions or its predecessors as Controller and now VP Finance. Alan spends approximately 10 hours per week working on Saebo-related issues, projects, etc., and is responsible for all financial functions and reporting for Saebo and many other related companies, primarily home health care and assisted living companies.

With executive roles in clinical and educational development, Scott has experience in almost every type of medical setting and managerial role possible. A seeker of knowledge, Scott holds Masters and Doctorate degrees in Occupational therapy, with advanced certifications in neurological treatment. While he is a full time (40 hours/week) employee of Saebo, he also participates in professional duties by holding advisory board positions for two occupational therapy schools and sits as an executive board member of his state’s occupational therapy association and foundation.
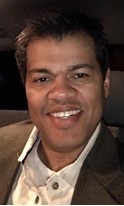
His job requirements involve the management of raw and finished Goods, Assembly, Imports and Exports, Purchasing, and Quality Control. Sean has worked in the manufacturing/production field for over 20 years and has been with Saebo for the last 10 years. Before joining Saebo he ran three manufacturing plants at one time for a Multinational craft company. While attending college for a business degree in management, he started working in the plants learning the different tasks in various departments from the bottom up. This has given him a solid foundation consisting of academic knowledge as well as hands-on experience.
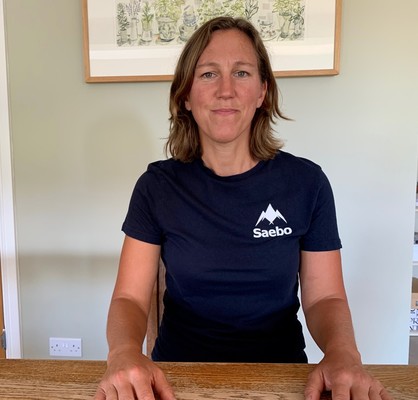
Amy is a Neurological Physiotherapist with over 18 years of clinical experience. Amy provides clinical support, training, and sales support for Saebo in the UK. Amy has grown her clinical experience in a variety of locations within the National Health Service in the UK, and also in private health care in Australia. Her switch to working with Saebo for the last 11 years comes from seeing the significant difference in rehabilitation outcomes using the Saebo range in her previous clinical role in Stroke Rehabilitation.
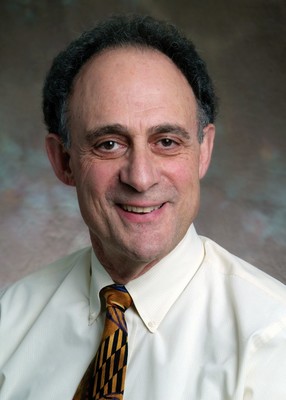
Dr. Wolf is a physical therapist and neuroscientist. His primary interests have been in researching ways to improve movement capabilities in aging and neurological populations. Until recently he also spent considerable time evaluating and treating patients diagnosed with stroke. He is past vice president of the Physical Therapy Association of Georgia and recipient of its Merit Award. While he has received numerous awards, those most relevant include: The Golden Pen Award, Lucy Blair Service Award, and The Helen J. Hislop Award for Outstanding Contributions to Literature. He has been a Catherine Worthingham Fellow of the APTA since 1987 and was the 2002 Mary McMillan Lecturer. Dr. Wolf’s professional contributions include establishing the inclusion criteria for forced use of the upper extremity following stroke and contributing to the formulation of what later became known as constraint-induced movement therapy, establishing Tai Chi as a falls’ prevention exercise for older adults, and helping to establish what is today known as the FiRST (Frontiers in Rehabilitation Science and Technology) Council of the APTA. Considered by some to be a bit of a visionary, he has received honors from multiple professional organizations, has authored or co-authored over 270 refereed articles; edited 9 books; procured over $70M in grant funding; and has provided over 800 national and international lectures. Dr. Wolf spends up to approximately 5 hours per month, as needed, consulting with Saebo on education topics, product development and industry trends.

A chartered physiotherapist specializing in stroke rehabilitation leading the Saebo UK limited company. Glyn has worked with the National Health Service and private practice as a clinical specialist in stroke rehabilitation. He now enjoys his active managing director role as an educator within the stroke rehabilitation industry. He has played a pivotal role is setting up the European Saebo distributorships.
Show 1 more personShow fewer
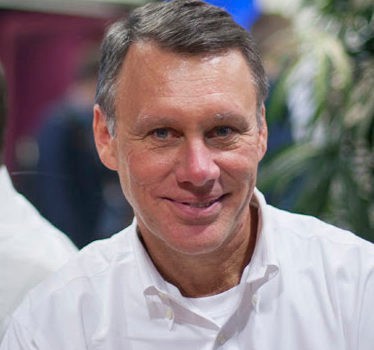
Todd is an experienced health care investor and operator with 30 years of experience in the DME, Home Health, Hospice, SNFs/ALFs and Rehabilitation industries. He spends about 50% of his time on Saebo. www.CHMGCapital.com. He is also a partner in www.CourageVenturesFunds.com, an early-stage VC fund based in Helsinki, Finland investing in digital health and wellness companies that aspire to enter the US Market. Since 2016 he has served as Honorary Consul of Finland for North and South Carolina.
Names and titles as disclosed on StartEngine, SEC Form C. Bios and photos come from the platform campaign page and may be out of date.
Reg CF annual-report compliance
Filed 3 of 6 annual reports (FY2020–FY2025)
Reg CF issuers must file a Form C-AR each year until a Rule 202(b) termination trigger is met.
SEC filings
View all 13 filings on EDGAR- Form C-ARMay 24, 20240001665160-24-000929EDGAR
- Form C-UJun 7, 20220001665160-22-001764EDGAR
- Form C-ARApr 27, 20220001665160-22-000993EDGAR
- Form C/AApr 27, 20220001665160-22-000985EDGAR
- Form C/AMar 28, 20220001665160-22-000552EDGAR
- Form C/AMar 25, 20220001665160-22-000538EDGAR
- Form C/AJan 24, 20220001665160-22-000133EDGAR
- Form C/AOct 25, 20210001665160-21-001870EDGAR
About this data. Figures are compiled from public sources — SEC EDGAR filings (Form C, C-AR, 1-A, 1-K) and funding-platform pages — and may be delayed, incomplete, or restated by the issuer. Financial statements are as reported by the issuer; each year is labeled with its assurance level (audited / reviewed / unaudited). A valuation cap is the conversion ceiling of a SAFE or convertible note, not an agreed company valuation; post-money figures are computed as pre-money plus amount raised and are not a traded price. Crowdonomics is not a broker-dealer, funding portal, or investment adviser; nothing here is investment advice or an offer to sell securities. Verify all figures against the linked EDGAR filings.