

SALEEN
Raising nowOperatingSALEEN AUTOMOTIVE, INC.
Industrial & Manufacturing · Corona, CA · Founded 2021
Well known company with a 40-year history in the automotive industry
This company has an open fundraising round.
Financials
FY2011–FY2025 (no data for FY2016, FY2017) · from SEC filings · hover any figure for its sourceChart shows the most recent 8 fiscal years; 5 earlier years are in the table below.
Figures as reported by the issuer in the filing shown on hover. Each year’s pill shows the assurance level of its filed statements — audited, reviewed (CPA review, less than an audit), or unaudited, as the filing’s own report or certification states it. A dashed pill marked * is inferred instead: the SEC minimum for an offering that size, which the issuer may have exceeded. No pill means we couldn’t tell. Headcount is the filing’s point-in-time count, not a year-end average. Manually corrected figures are marked “Corrected”.
Valuation over rounds
Pre-money — the valuation set before each round’s money came inBlue bars are the pre-money valuation the company stated for a priced round. Dotted grey bars are our estimate for rounds that didn't state one: the round's share price × the shares outstanding in its filings. Same measure as blue, but rougher. Dashed amber bars are a SAFE or convertible note's valuation cap — the most it converts at, not what the company is worth, so don't compare them with the other bars.
Share price over rounds
Disclosed sales come from the issuer's own filings (prior-offering lines, audited-statement notes) and are amount ÷ securities sold. A down round is a firm point more than 25 % below the previous firm point of the same share class on a comparable basis; the comparison ignores unverified and year-only lines.
Cap table
Share counts as of Mar 31, 2026| Class | Outstanding | Votes / share | Share of total | Last price |
|---|---|---|---|---|
| Common Stock | 29,887,622 | 1 | 100.0% | $1.25May 2024 |
Shares outstanding over timein today's share terms
Changes in named holdersshares in today's terms · % of all shares at the time
- Steve Saleen41K (59.6%) Jun 2014 → 4.0M (297431.3%) Dec 2021 → 600 (0%) Feb 2026
Principal holders% as the filing states it, Jun 5, 2026
- Steve Saleen600 Series B Preferred Stock100.0%of Series B Preferred
- Steve Saleen6,282,734 Common Stock21.4%of
Sold to the crowd
- Reg A+ · Dec 2021155,950 shares at $1.00$156K
- Reg CF · Jul 2023843,749 shares at $1.25$1.1M· 881 investors
- Reg CF · May 2024337,315 shares at $1.25$421.6K
- Reg CF · Aug 2026SAFE$121.5K· 89 investors
From the company's SEC filings: share counts per class, each class's voting and conversion terms, and the holders of 20% or more that Form C requires (officers and 10%+ holders on Form 1-A). Filings name only large holders, so most owners — including crowd investors — are not listed, and a holder's percentage may be of its own class rather than of the whole company. Prices and crowd share counts are in today's share terms — adjusted for splits and conversions since they were sold. Hover a figure for its filing.
Fundraising history
Team
13 people
Steve Saleen is our founder and CEO. A championship-winning race driver turned manufacturer, he built the Ford GT for Ford Motor Company, holds 25 patents across vehicle design, engineering, and production, and earned a business degree from USC.
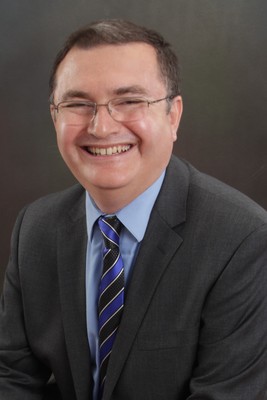
Charles Arzubiaga has over 30 years of accounting and finance experience with both private and public companies. In the past he has worked in manufacturing and distribution, primarily as a department head or leader of an interdepartmental team. He is a graduate of the University of California Santa Barbara, with a degree in Business Economics and an emphasis in Accounting and can sometimes be fanatical about his beloved Running Gauchos men’s basketball team. When not at work, Charles enjoys traveling, live theater and dining with his wife Michelle and son Michael.
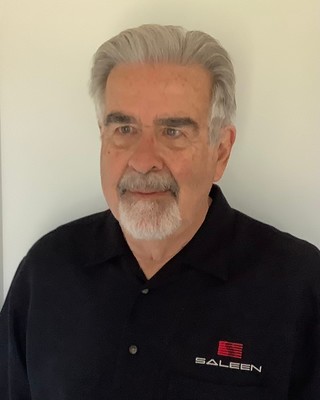
Fred Blum currently serves as the Vice-President of Retail and Sales for Saleen Automotive. Prior to this role, Fred served as President of US Automotive International, a consulting firm focused on advising clients in the automotive industry on sales, marketing and distribution. Fred has also served as Executive Director of the Aljomaih Automotive Company, a distributor of General Motors in Saudi Arabia. Fred has a Bachelor's Degree in Business from the University of Minnesota, Carlson School of Business.
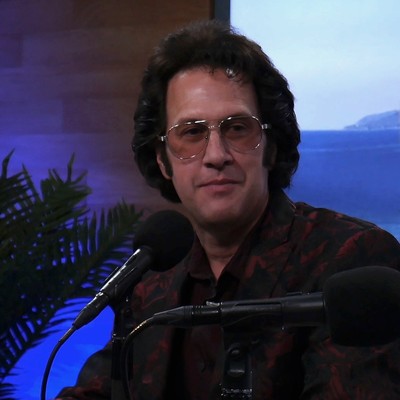
Gregory Stacy is Vice President of Marketing at Saleen Automotive. Greg is a consummate auto enthusiast with over 25 years of writing, producing and directing automotive content. He began his career as a producer/cameraman and went on to produce and direct over 150 episodes of the award winning, weekly TV series Hot Rod Magazine on Speed Channel. He was the creative director and instrumental in launching the broadband, streaming network Torque.tv which became Motortrend OnDemand, and was later sold to Discovery Communications. Throughout his career in advertising he has worked with many automobile OEMs such as Acura, Honda, Fiat, Lexus, Toyota, Jeep, Dodge and Ram to name a few. Prior to joining Saleen, he was an executive producer at the world renowned Trailer Park agency in Hollywood, CA. While at Trailer Park, Greg was one of the leads and creative forces behind a series of Alfa Romeo commercials, and was the EP on the Alfa Romeo Super Bowl campaign that launched them back into the US market. Greg holds a BSME degree along with a MFA degree. He is a recipient of numerous CLIOs, Tellys, and ProMax/BDA advertising and content awards.
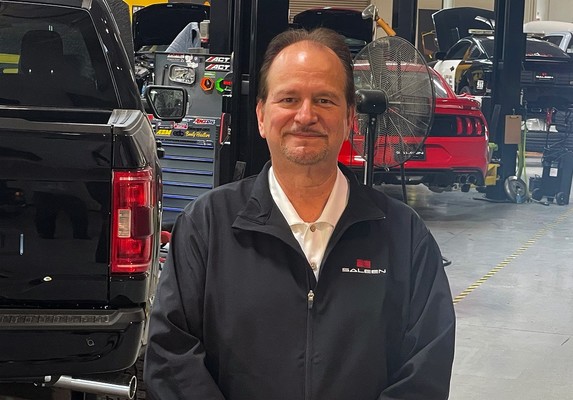
Paul Moore is currently the Vice President of Operations at Saleen Automotive. He started his career in manufacturing at Boeing in the aircraft industry and earned many awards relating to quality standards and training of personnel. Paul was then chosen by the legendary Vic Edelbrock as the General Manager of the Exhaust & Suspension Divisions. He managed all aspects of Manufacturing and Engineering, introduced robotics and automation to the production process and oversaw the development of the Adjustable Trailing Arm which won Best Design at Sema. Paul also discovered and introduced Cerakote ceramic high temperature coatings to the aftermarket exhaust industry. Cerakote is currently utilized in most exhaust applications and is considered the industry leader. Paul then worked for Magnaflow Exhaust where he was the Project Manager in charge of designing and introducing headers as well as improving the design and automation of the successful Exhaust Manifold line. Paul is now overseeing Operations and Procurement for Saleen Automotive. He is focused on raising the efficiency, cost savings, quality and productivity of the builds. He works closely with engineering on new projects to achieve superior design and industry leading performance.
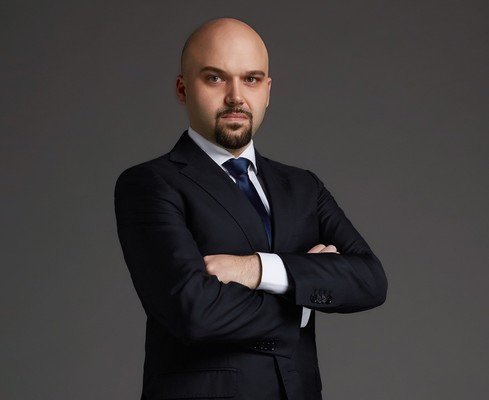
Werner Gruber is Vice President of Design at Saleen Automotive. He started his Career at Pininfarina, one of the most famous design houses in the automotive field. In 2010 he joined Ferrari and was the senior lead exterior designer of the LaFerrari, FXX-K and the Ferrari Portofino. In 2019 he joined Saleen and was involved in the Development of the Saleen S1, and the Saleen Formula; a track-only, formula spec racecar. Having insight into the latest technology for the burgeoning EV marketplace, he worked as a consultant for BYD – Shenzhen, supervising numerous vehicles until 2021. He has been a recipient of numerous design awards; including RedDot for the LaFerrari in 2015, RedDot Best of the Best in 2015 for the Ferrari FXX-K. His Projects also won the IF Gold Award for 2016, and RedDot Best of the Best for the Ferrari Portofino in 2018.
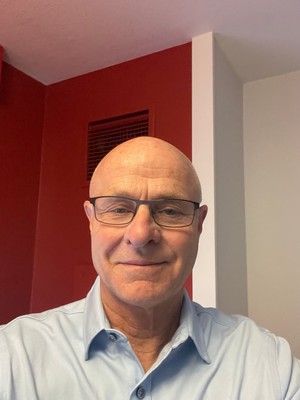
Dennis is the founding member of The Hartmann Law Group, a practice he commenced in 1990. His extensive litigation experience includes complex business litigation involving breach of fiduciary duty, employment, intellectual property and other business related matters. Dennis’ litigation experience also includes real estate matters, fraud, entertainment, partnership dissolution, pursuing fraudulent conveyances and breaking offshore trusts to dismantle vehicles with no purpose other than to hid assets. In addition to serving as lead counsel in multi-year trials involving financial fraud and breach of fiduciary duty, he has developed legal strategies, overseen all facts of pre-trial discovery, and argued motions before the trial court and the Court of Appeal. In 2015, Dennis and his firm successfully litigated a breach of fiduciary case in connection with a fraudulent sale of real estate that was awarded the largest judgment in California ($68,000,000) as reported in the Daily Journal. Dennis graduated Summa Cum Laude from University of Alabama and from the University of Texas School of Law (Austin) as a member of the Texas Law Review. Dennis works approximately 1 hour on an average weekly basis for Saleen.
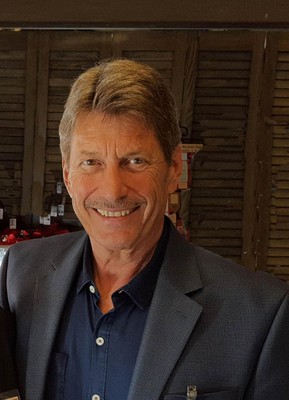
Mr. Deschenes is currently retired after having been active as an executive in the automobile industry for over 37 years. Most recently, Mr. Deschenes served as the Managing Director of Rampage Products, a Jeep accessory company, from January 2006 until March 2016. He holds a B.S. in Business Administration from California State University, Fullerton. Mr. Deschenes’ experience as an automobile industry executive qualifies him to serve as a director. Michael works approximately 1 hour on an average weekly basis for Saleen.
Show 4 more peopleShow fewer
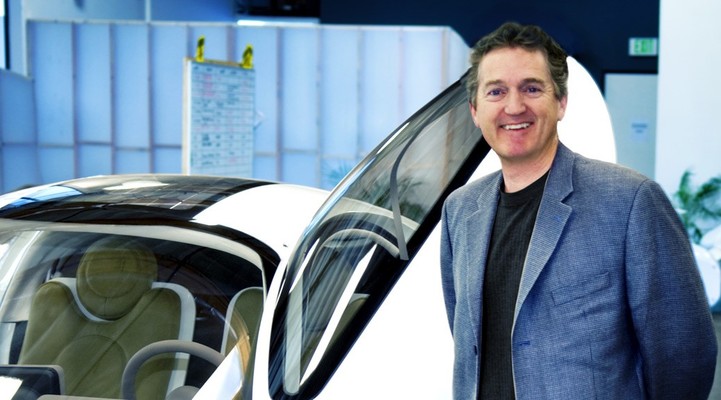
Mr. Hannemann is currently a member of the board of directors for Saleen. Mr. Hannemann began his automotive career by attending General Motors Institute. Upon graduation he worked at Minicars, Inc., involved in government contracts regarding vehicle safety. He then took a job with Chrysler working at the Chrysler/Shelby Performance Center, which was run by automotive legend Carroll Shelby, where Neil was involved in research for vehicle performance and the development of specialty Shelby products. Neil was also a development engineer for the Dodge Viper, a program manager for the Viper GTS/R racing program, and a program manager for the Dodge NASCAR effort. After almost 20 years with Chrysler, Neil then went to Saleen to work for another automotive legend, Steve Saleen, to develop the road going version of the Saleen S7. This led to Neil becoming the Chief Engineer for the Ford GT, and Saleen was involved in the manufacturing of that vehicle. Finally, Neil went to another legendary company, McLaren to again develop road going supercars for the McLaren brand. Since 2007, Neil has been a consultant working in a wide range of areas with a focus on supporting litigation related to vehicle safety. Neil works approximately 1 hour on an average weekly basis for Saleen.
Names and titles as disclosed on SEC Form 1-A, SEC Form C, StartEngine, WeFunder. Bios and photos come from the platform campaign page and may be out of date.
Reg CF annual-report compliance
Filed 2 of 3 annual reports (FY2023–FY2025)
Reg CF issuers must file a Form C-AR each year until a Rule 202(b) termination trigger is met.
SEC filings
View all 44 filings on EDGAR- Form C/ASep 28, 20260001528098-26-000012EDGAR
- Form CAug 27, 20260001528098-26-000011EDGAR
- Form C-UJul 22, 20260001528098-26-000010EDGAR
- Form C-AR/AJun 5, 20260001528098-26-000008EDGAR
- Form CJun 1, 20260001528098-26-000007EDGAR
- Form C-ARFeb 25, 20260001528098-26-000005EDGAR
- Form CMay 7, 20240001493152-24-017967EDGAR
- Form C-ARMay 3, 20240001493152-24-017769EDGAR
About this data. Figures are compiled from public sources — SEC EDGAR filings (Form C, C-AR, 1-A, 1-K) and funding-platform pages — and may be delayed, incomplete, or restated by the issuer. Financial statements are as reported by the issuer; each year is labeled with its assurance level (audited / reviewed / unaudited). A valuation cap is the conversion ceiling of a SAFE or convertible note, not an agreed company valuation; post-money figures are computed as pre-money plus amount raised and are not a traded price. Crowdonomics is not a broker-dealer, funding portal, or investment adviser; nothing here is investment advice or an offer to sell securities. Verify all figures against the linked EDGAR filings.