

SciTech Development, L.L.C.
OperatingSCITECH DEVELOPMENT L.L.C.
Biotech · Biotech · Grosse Pointe Farms, MI · Founded 2000
Advancing cancer treatment through safer drug delivery
Financials
FY2019–FY2025 · from SEC filings · hover any figure for its sourceFigures as reported by the issuer in the filing shown on hover. Each year’s pill shows the assurance level of its filed statements — audited, reviewed (CPA review, less than an audit), or unaudited, as the filing’s own report or certification states it. A dashed pill marked * is inferred instead: the SEC minimum for an offering that size, which the issuer may have exceeded. No pill means we couldn’t tell. Headcount is the filing’s point-in-time count, not a year-end average. Manually corrected figures are marked “Corrected”.
Valuation over rounds
Pre-money — the valuation set before each round’s money came inBlue bars are the pre-money valuation the company stated for a priced round.
Cap table
Principal holders% as the filing states it, Mar 15, 2022
- Owned Earle T. Holsapple10,238,173 shares65.3%of company
- Ralph Parchment5,451,104 shares34.7%of company
Sold to the crowd
- Reg CF · Mar 202230,588 shares at $2.75$84.1K· 100 investors
From the company's SEC filings: share counts per class, each class's voting and conversion terms, and the holders of 20% or more that Form C requires (officers and 10%+ holders on Form 1-A). Filings name only large holders, so most owners — including crowd investors — are not listed, and a holder's percentage may be of its own class rather than of the whole company. Prices and crowd share counts are in today's share terms — adjusted for splits and conversions since they were sold. Hover a figure for its filing.
Fundraising history
Team
8 people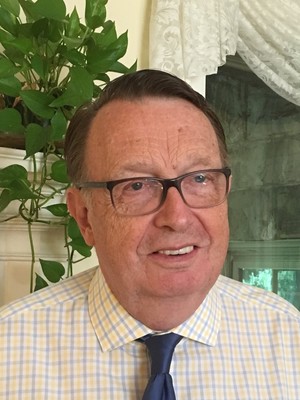
Mr. Holsapple has extensive managerial experience spanning many decades in a wide host of industries. He has successfully served as CEO/COO of six profitable midsize industrial or consumer products companies ranging in size from $10M to $100M in sales. He has managed four corporate turnarounds restoring each company to financial health. As an entrepreneur, he has started four new companies ranging in focus from international trade to complex life science startups. He previously served his country as an air defense officer in the United States Marine Corps rising to the rank of Captain.
Dr. Parchment is an accomplished pharmacologist and the principal inventor of the SciTech drug delivery technology. He presently directs a multi-laboratory program at the Frederick National Laboratory for Cancer Research where he manages the effort to create innovative approaches for evaluating and developing new drug compounds. He has worked part-time supporting SciTech’s development, patenting and commercialization activities. He brings a wealth of knowledge, in the field of oncology drug development, to bear on SciTech’s behalf. He invented ST-001 while on the faculty of Wayne State University where he was a core leader for the Karmanos Cancer Institute (KCI).

Mr. Stumpf brings 20+ years of experience as a finance professional in private equity, investment banking, corporate finance, and public accounting. Mr. Stumpf serves on the board of directors of a public diversified holding company as a member on the audit, compensation and nominating committees. Mr. Stumpf is a partner with Storm Lake Capital, a private equity firm that invests in middle market companies. Mr. Stumpf also performs in a finance capacity for several portfolio companies with responsibilities including financial and strategic planning and budgeting, financial reporting and year-end audit and tax filings.

Dr. Scarmoutzos has over 30 years of industrial experience in the biotech, chemistry, healthcare, medical device, pharmaceutical, and related industries. His hands-on industrial experience ranges from Bench Top Scientist to Vice President of R&D to President and CEO. He has founded several companies and is currently a Board Member of several small and emerging companies. Dr. Scarmoutzos received his B.S. cum laude in Chemistry from Boston College, a Ph.D. summa cum laude in Organic Chemistry from the Pennsylvania State University and was a Post-Doctoral Fellow in the Department of Chemistry and Chemical Biology at Harvard University.

Dr. Moiin is board certified in Dermatology and is a practicing Dermatologist. He has an extensive background in treating patients with cutaneous T-cell lymphoma (CTCL) and is a lead researcher for ST-001 as a topical therapeutic. He maintains affiliations with major medical centers in the Detroit metro area, including Detroit Medical Center, St. John's Hospital, St. Mary's Hospital and William Beaumont Hospital. Dr. Moiin received his bachelor's degree in pharmacology and master's degree in biology from the University of California, Santa Barbara. He was awarded his Doctor of Medicine degree from the University of California, Davis.
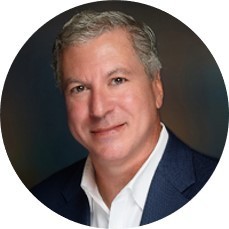
Mr. Schaffer has 30 years of experience in global equity capital markets, investment banking, equity market research, investor relations and strategic advisory to public/private funds. His skills include P&L accountability, customer retention, collaborative product development, business planning across diverse global markets resulting in increased bottom-line and market share growth. Mr. Schaffer has held executive positions at Raymond James Global Equity Markets, Kaufman, Advest and BD/M Collective.
Dr. Burns has nearly 40 years of pharmaceutical industry experience; Past CEO of Ferndale Pharma Group which comprises companies that specialize in the development, manufacture, marketing, sale and distribution of a wide variety of healthcare products. Dr. Burns was also CEO of Repromedix Corp, a life science company providing advanced testing and advisory services in reproductive medicine. He was instrumental in the divestment of ReproSource, Inc. Dr. Burns is an advisor to startup companies in oncology, skin care, and reproductive medicine.
Names and titles as disclosed on SEC Form C, StartEngine. Bios and photos come from the platform campaign page and may be out of date.
Reg CF annual-report compliance
Filed 4 of 5 annual reports (FY2021–FY2025)
Reg CF issuers must file a Form C-AR each year until a Rule 202(b) termination trigger is met.
SEC filings
View all 15 filings on EDGAR- Form C-ARApr 29, 20260001682585-26-000004EDGAR
- Form C-ARApr 29, 20260001682585-26-000007EDGAR
- Form DOct 15, 20240001682585-24-000002EDGAR
- Form DMay 17, 20230001682585-23-000001EDGAR
- Form C-ARMay 2, 20230001665160-23-001171EDGAR
- Form C-UAug 1, 20220001665160-22-002142EDGAR
- Form C/AJun 28, 20220001665160-22-001904EDGAR
- Form C/AJun 17, 20220001665160-22-001832EDGAR
About this data. Figures are compiled from public sources — SEC EDGAR filings (Form C, C-AR, 1-A, 1-K) and funding-platform pages — and may be delayed, incomplete, or restated by the issuer. Financial statements are as reported by the issuer; each year is labeled with its assurance level (audited / reviewed / unaudited). A valuation cap is the conversion ceiling of a SAFE or convertible note, not an agreed company valuation; post-money figures are computed as pre-money plus amount raised and are not a traded price. Crowdonomics is not a broker-dealer, funding portal, or investment adviser; nothing here is investment advice or an offer to sell securities. Verify all figures against the linked EDGAR filings.