

Shacksbury
OperatingShacksbury Holdings Inc.
Alcohol · Brewery · Vergennes, VT · Founded 2013
Shacksbury is a cidery based in the Champlain Valley of Vermont - a place defined by community and an outdoor, active lifestyle. We produce and sell a portfolio of low sugar, low calorie beverages that are always pushing forward and never straying from the natural beauty our home state is known for. Beginning in 2013, we began to make dry, unique ciders—the backbone of the company—while now expanding our offerings to other ready-to-drink beverages to meet the evolving market around us.
Financials
FY2018–FY2025 · from SEC filings · hover any figure for its sourceFigures as reported by the issuer in the filing shown on hover. Each year’s pill shows the assurance level of its filed statements — audited, reviewed (CPA review, less than an audit), or unaudited, as the filing’s own report or certification states it. A dashed pill marked * is inferred instead: the SEC minimum for an offering that size, which the issuer may have exceeded. No pill means we couldn’t tell. Headcount is the filing’s point-in-time count, not a year-end average. Manually corrected figures are marked “Corrected”.
Valuation over rounds
Pre-money — the valuation set before each round’s money came inBlue bars are the pre-money valuation the company stated for a priced round. Dotted grey bars are our estimate for rounds that didn't state one: the round's share price × the shares outstanding in its filings. Same measure as blue, but rougher.
Share price over rounds
Disclosed sales come from the issuer's own filings (prior-offering lines, audited-statement notes) and are amount ÷ securities sold. A down round is a firm point more than 25 % below the previous firm point of the same share class on a comparable basis; the comparison ignores unverified and year-only lines.
Cap table
Share counts as of Apr 24, 2026| Class | Outstanding | Votes / share | Share of total | Last price |
|---|---|---|---|---|
| Common Stock | 3,249,980 | 1 | 100.0% | $2.15Jan 2024 |
Principal holders% as the filing states it, Apr 24, 2026
- Colin Davis584,837 Common Stock16.2%of company
- David Dolginow584,837 Common Stock16.2%of company
- Everyone else (not named in filings)67.7%
Sold to the crowd
- Reg CF · Sep 2020292,785 shares at $3.53$1M· 498 investors
- Reg CF · May 2021164,777 shares at $3.66$603.1K· 296 investors
- Reg CF · Jan 202476,884 shares at $2.15$165.3K· 81 investors
From the company's SEC filings: share counts per class, each class's voting and conversion terms, and the holders of 20% or more that Form C requires (officers and 10%+ holders on Form 1-A). Filings name only large holders, so most owners — including crowd investors — are not listed, and a holder's percentage may be of its own class rather than of the whole company. Prices and crowd share counts are in today's share terms — adjusted for splits and conversions since they were sold. Hover a figure for its filing.
Fundraising history
Team
4 people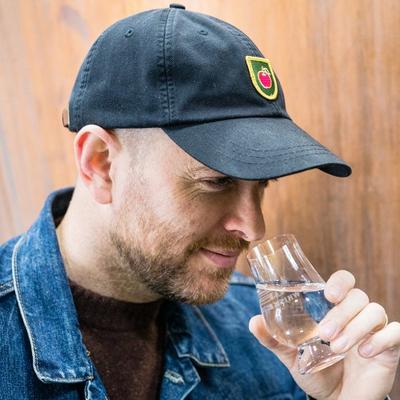
David grew up in Kansas City in a family of retailers and entrepreneurs and the apple doesn't fall far... After spending three years at Sunrise Orchards in Vermont, David started Shacksbury with Colin in spring 2013, after an exciting but nerve-racking conversation at dollar Miller draft night at Big Moose Pub to outline their partnership.

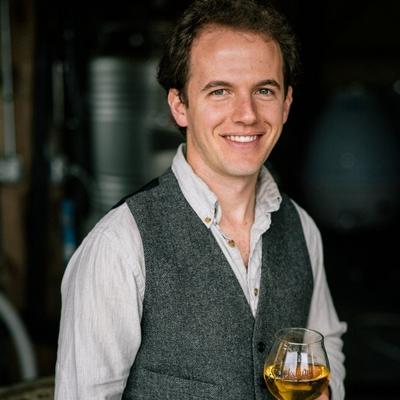
Born and raised in New Orleans, Elizabeth found herself around a friend's kitchen table in New York City drinking Shacksbury and it was love at first sip. You can currently find her between New York City and New Orleans where she runs her company, Oyster Sunday. Although culinary is her passion, she regrets not going to space camp but believes there is still time.
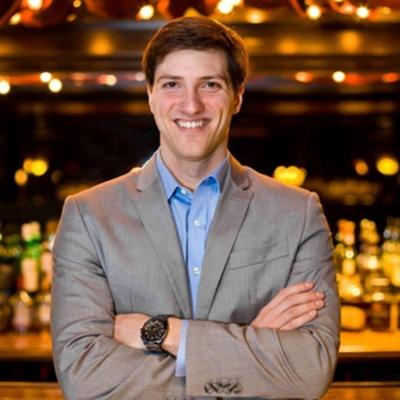
Gregory is a global, strategic leader with a demonstrated track record of developing and implementing successful spirits industry strategies. He has 10+ years of experience building, scaling, and leading cross-functional teams across high-growth organizations. He is currently COO at Coconut Cartel Rum.
Names and titles as disclosed on SEC Form C, StartEngine. Bios and photos come from the platform campaign page and may be out of date.
Reg CF annual-report compliance
Filed 6 of 6 annual reports (FY2020–FY2025)
Reg CF issuers must file a Form C-AR each year until a Rule 202(b) termination trigger is met.
SEC filings
View all 14 filings on EDGAR- Form C-ARApr 24, 20260001824937-26-000002EDGAR
- Form C-ARMay 1, 20250001665160-25-000951EDGAR
- Form C-ARMay 1, 20240001665160-24-000744EDGAR
- Form C-UApr 19, 20240001665160-24-000398EDGAR
- Form CJan 9, 20240001665160-24-000011EDGAR
- Form C-ARMay 1, 20230001665160-23-001067EDGAR
- Form C-ARApr 15, 20220001665160-22-000656EDGAR
- Form C-UJan 6, 20220001665160-22-000053EDGAR
About this data. Figures are compiled from public sources — SEC EDGAR filings (Form C, C-AR, 1-A, 1-K) and funding-platform pages — and may be delayed, incomplete, or restated by the issuer. Financial statements are as reported by the issuer; each year is labeled with its assurance level (audited / reviewed / unaudited). A valuation cap is the conversion ceiling of a SAFE or convertible note, not an agreed company valuation; post-money figures are computed as pre-money plus amount raised and are not a traded price. Crowdonomics is not a broker-dealer, funding portal, or investment adviser; nothing here is investment advice or an offer to sell securities. Verify all figures against the linked EDGAR filings.