

Shark Wheel
Raising nowOperatingShark Wheel, Inc.
Agriculture · Lake Forest, CA
Reinventing the wheel
This company has an open fundraising round.
Financials
FY2015–FY2025 · from SEC filings · hover any figure for its sourceChart shows the most recent 8 fiscal years; 3 earlier years are in the table below.
Figures as reported by the issuer in the filing shown on hover. Each year’s pill shows the assurance level of its filed statements — audited, reviewed (CPA review, less than an audit), or unaudited, as the filing’s own report or certification states it. A dashed pill marked * is inferred instead: the SEC minimum for an offering that size, which the issuer may have exceeded. No pill means we couldn’t tell. Headcount is the filing’s point-in-time count, not a year-end average. Manually corrected figures are marked “Corrected”.
Valuation over rounds
Pre-money — the valuation set before each round’s money came inBlue bars are the pre-money valuation the company stated for a priced round.
Share price over rounds
Disclosed sales come from the issuer's own filings (prior-offering lines, audited-statement notes) and are amount ÷ securities sold. A down round is a firm point more than 25 % below the previous firm point of the same share class on a comparable basis; the comparison ignores unverified and year-only lines, and each class is drawn as its own line.
Cap table
Principal holders% as the filing states it, Sep 8, 2026
- Gary Fleishman3,768,888 Class A Common Stock50.0%of votes
Sold to the crowd
- Reg CF · Jul 2017528,753 shares at $1.00$528.8K· 588 investors
- Reg CF · Jan 2019230,870 Class C Common Stock at $2.29$528.7K· 456 investors
- Reg CF · Nov 2019335,306 shares at $1.77$593.5K· 766 investors
- Reg CF · Nov 2020259,880 shares at $2.06$535.4K· 625 investors
- Reg CF · Jul 2021420,355 shares at $2.29$962.6K· 812 investors
- Reg CF · Jun 2022175,197 shares at $2.29$401.2K· 400 investors
- Reg CF · Sep 2026Convertible Note$171.6K
From the company's SEC filings: share counts per class, each class's voting and conversion terms, and the holders of 20% or more that Form C requires (officers and 10%+ holders on Form 1-A). Filings name only large holders, so most owners — including crowd investors — are not listed, and a holder's percentage may be of its own class rather than of the whole company. Prices and crowd share counts are in today's share terms — adjusted for splits and conversions since they were sold. Hover a figure for its filing.
Fundraising history
Team
13 people
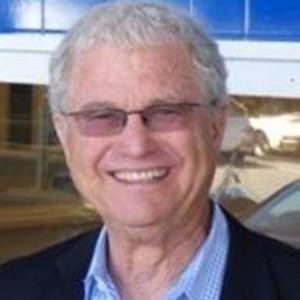
Gary has management and business expertise in running companies for over 35 years. He has served as the Senior Vice-President & Regional Manager for the world’s largest real estate company, Coldwell Banker. Gary does not take a salary from Shark Wheel and only works intermittently. He is involved in high-level Shark Wheel dealings. 1 hour per week.

Donna Thompson has offered bookkeeping services since 1988. She services a wide range of small businesses from sporting goods companies to clinical trials companies to medical / wellness companies as well as Non-Profit entities. Donna’s signature motto is “our number one goal is to keep our customers for life”. She prides herself in relationship building and has worked with her largest client since 1991. Donna volunteers yearly for Volunteer Income Tax Assistance (VITA) and AARP as a tax preparer. She holds a Federal Personal Tax Identification Number (PTIN) to prepare taxes and is in good standing with California Tax Education Council. Donna is a member of National Association of Certified Public Bookkeepers.


Show 4 more peopleShow fewer

Mechanical Engineer with over 20 years of seasoned and successful professional experience. He has designed many different products moving these designs from concept to production for innovators, startups and established companies. Professional degreed mechanical design engineer with an MBA. Experienced as a technical lead with in house designs, ODM, and OEM, as well as partnership designs. Todd’s experience includes high volume production design, concept designs, reference designs, and validation tool design. Part time worker, roughly 3 hours per week.
Highly motivated and innovative Anderson MBA marketing leader with 15+ yrs experience in consumer products including health & beauty, social media and international assignments. Proven record of driving superior results for global brands. Nicole is available for consulting hours, but does not have a set amount of part-time work she allocates to the company.

Professor Alpert’s current position is Foley's Professorship in Retailing, Department of Marketing Administration, Graduate School of Business, The University of Texas at Austin. Professor Alpert has been featured in dozens of academic books. Professor Alpert is available for consulting hours, but does not have a set amount of part-time work he allocates to the company.

Steven works on a wide variety of business development topics including: product distribution, licensing deals, contract negotiations, marketing, financing opportunities and overall global company strategy. Steven is available for consulting hours, but does not have a set amount of part-time work he allocates to the company.
Names and titles as disclosed on StartEngine, SEC Form C. Bios and photos come from the platform campaign page and may be out of date.
Reg CF annual-report compliance
Filed 9 of 9 annual reports (FY2017–FY2025)
Reg CF issuers must file a Form C-AR each year until a Rule 202(b) termination trigger is met.
SEC filings
View all 31 filings on EDGAR- Form CSep 22, 20260001709539-26-000002EDGAR
- Form C-ARSep 8, 20260001709539-26-000001EDGAR
- Form COct 9, 20250001709539-25-000004EDGAR
- Form C-ARJun 17, 20250001709539-25-000003EDGAR
- Form C-ARApr 30, 20240001709539-24-000003EDGAR
- Form C-ARApr 27, 20230001709539-23-000002EDGAR
- Form C-UJan 31, 20230001665160-23-000161EDGAR
- Form C/AJan 5, 20230001665160-23-000022EDGAR
About this data. Figures are compiled from public sources — SEC EDGAR filings (Form C, C-AR, 1-A, 1-K) and funding-platform pages — and may be delayed, incomplete, or restated by the issuer. Financial statements are as reported by the issuer; each year is labeled with its assurance level (audited / reviewed / unaudited). A valuation cap is the conversion ceiling of a SAFE or convertible note, not an agreed company valuation; post-money figures are computed as pre-money plus amount raised and are not a traded price. Crowdonomics is not a broker-dealer, funding portal, or investment adviser; nothing here is investment advice or an offer to sell securities. Verify all figures against the linked EDGAR filings.