

SHIFTPOSTS BY FOURQ TECHNOLOGIES, INC.
OperatingFourQ Technologies Inc.
Software & AI · Stillwater, MN · Founded 2018
Workforce management in real-time for healthcare industries
Financials
FY2018–FY2025 · from SEC filings · hover any figure for its sourceFigures as reported by the issuer in the filing shown on hover. Each year’s pill shows the assurance level of its filed statements — audited, reviewed (CPA review, less than an audit), or unaudited, as the filing’s own report or certification states it. A dashed pill marked * is inferred instead: the SEC minimum for an offering that size, which the issuer may have exceeded. No pill means we couldn’t tell. Headcount is the filing’s point-in-time count, not a year-end average. Manually corrected figures are marked “Corrected”.
Valuation over rounds
Pre-money — the valuation set before each round’s money came inBlue bars are the pre-money valuation the company stated for a priced round. Dotted grey bars are our estimate for rounds that didn't state one: the round's share price × the shares outstanding in its filings. Same measure as blue, but rougher. Dashed amber bars are a SAFE or convertible note's valuation cap — the most it converts at, not what the company is worth, so don't compare them with the other bars.
Share price over rounds
Disclosed sales come from the issuer's own filings (prior-offering lines, audited-statement notes) and are amount ÷ securities sold. A down round is a firm point more than 25 % below the previous firm point of the same share class on a comparable basis; the comparison ignores unverified and year-only lines.
Cap table
Share counts as of Dec 31, 2021| Class | Outstanding | Votes / share | Share of total | Votes | Liquidation | Last price |
|---|---|---|---|---|---|---|
| Series A Preferred Stockpreferred | 560,880 | none | 46.3% | 0% | 1× | — |
| Common Stock | 650,000 | 1 | 53.7% | 100.0% | — | — |
| Total | 1,210,880 | 100% | 100% |
Principal holders% as the filing states it, Apr 25, 2024
- Elizabeth Cooper37.7%of company
Sold to the crowd
- Reg CF · Nov 2020$749.6K
- Reg CF · Sep 20233,399 Series B Preferred Shares at $7.91$26.9K· 35 investors
From the company's SEC filings: share counts per class, each class's voting and conversion terms, and the holders of 20% or more that Form C requires (officers and 10%+ holders on Form 1-A). Filings name only large holders, so most owners — including crowd investors — are not listed, and a holder's percentage may be of its own class rather than of the whole company. Prices and crowd share counts are in today's share terms — adjusted for splits and conversions since they were sold. Hover a figure for its filing.
Fundraising history
Team
10 people
Elizabeth is a serial entrepreneur and investor with a career that has spanned Cleantech to Healthcare. She has helped develop 50+ startups, working closely with top venture firms including Accel Partners and NEA. She previously served as Global CEO of IDG Channels and sold her spin-out firm to WPP, YnR. Her position and process has been the topic of multiple KeyNotes for the likes of Microsoft, Oracle, SunMicrosystems, IBM and others.

Dave is a veteran of the healthcare industry and is a seasoned CEO and founder. Prior to helping to Co-Found FourQ Technologies Inc. led several managed care technology companies, including Medication Management Systems, Inc. (acquired by Genoa HealthCare), NovoLogix (acquired by CVS), and RxHub. Previously, Dave was CEO of United Resource Networks at United Health Group, a business that managed organ and tissue transplants for 45 million payer lives, and SVP at American MedCenters, an HMO management company. Dave holds a BS in Pharmacy from Ohio State University and a Ph.D. from the University of Minnesota. Dave has 40+ years of healthcare experience, including CEO positions at NovoLogix, RxHub, and United Resource Networks. He started as a pharmacist and recently sold Medication Management Systems a precursor to FourQ Technologies Inc. Resulting profits from the sale benefited industry giants including CVS. Dave now serves as CEO of Emerging Therapy Solutions, Inc. and remains an active industry speaker.
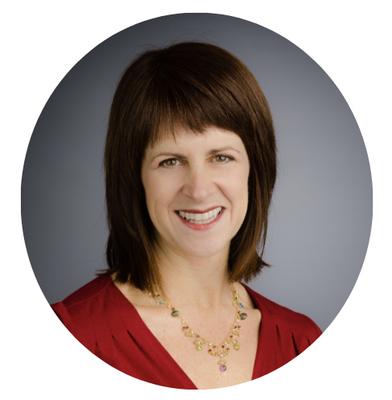
Nancy Benjamin started her career with large national ad agencies—Della Femina, Euro RSCG and others—rolling out product launches for more than 17 national brands including Godiva, Campbell's, Keebler, and Sara Lee. Adept at brand messaging and strategy, she then started consulting startups on honing their brands and improving marketing penetration, as well as optimizing internal apps for clarity and retention. In her current position as VP of Marketing of ShiftPosts, she creative directs all marketing, ensuring that it meets company objectives, ensuring all clients have an exceptional experience, and encouraging prospects to join the community. Part Time: 5-6 hours per week.


Aaron is in his 9th year in digital marketing. He began as a generalist working in SEO/SEM/SMM - 3 years in he switched his focus to just SEM/SMM and another 3 years later he began specializing in Lead Generation. He has been working with the ShiftPosts team for just over 2 years helping to blueprint their messaging, ad placement i.e. media buys, and audience targeting. Part Time: 2-4 hours per week.
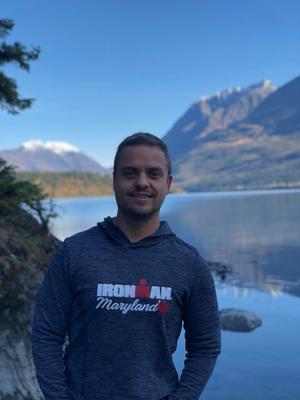
Aaron Marks is a marketing strategist with Avalaunch Media and has been with the company for two and a half years. He has over 19 years of experience in client facing roles overseeing traditional, event focused, and digital marketing campaigns. He has coordinated media advertising sales plus on air production and voiceover work. At Avalaunch Media he provides digital marketing strategy and guidance to clients all over the country. He is currently the race director for the Avalaunch Gives Back 5k every fall, and is in the process of building a new department at Avalaunch that focuses on Traditional Media Placement. In addition to his work at Avalaunch, he is also an Adjunct Professor for Intro to Digital Marketing at the Woodbury School of Business at Utah Valley University. Aaron graduated from Virginia Tech with a degree in Mass Communications and Broadcasting in 2005, and earned his masters degree specializing in Digital Marketing at Rutgers Business School in 2021. Part Time: 5-8 hours per week

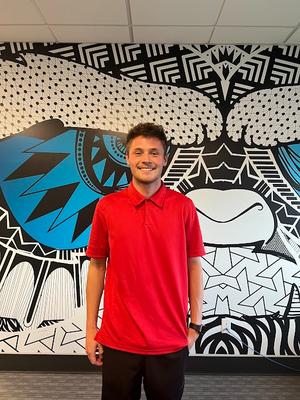
Garrett Peterson has been part of the Avalaunch Media team for two years. In his role, he specializes in optimizing and refining digital marketing strategies, primarily on platforms like Google Ads and Facebook Ads where I optimize to achieve tangible results. Garett ensures every ad dollar counts, optimizing budgets. He thrives on data-backed insights and A/B testing to improve campaign performance. Garrett has gained experience building strong client relationships through meaningful communication and is committed to staying ahead of industry trends, continuously enhancing my skills and knowledge. Part Time: 5-7 Hours per week.
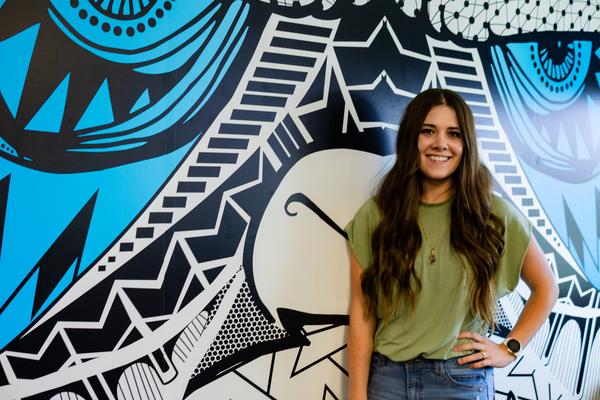
Nikita is a seasoned digital marketing professional with a passion for seeing impactful online strategies launch brands. With over a decade of experience in the industry, she has had the privilege of helping businesses thrive in the digital landscape. When she is not immersed in the world of marketing, you can find her exploring the great outdoors and staying active. Since April 2013, Nikita has dedicated her career to the dynamic field of digital marketing. Her journey has led me to my current role as a Digital Marketing Project Manager at Avalaunch Media, where she has contributed her strengths since November 2018. She thrives in this fast-paced environment, working closely with our partners to develop and execute digital marketing campaigns that drive measurable results. Part Time 2-4 hours per week.
Show 1 more personShow fewer

Pat is a recognized leader in The Healthcare Industry and the former CEO of Sutter Health, the US's second largest healthcare provider. Pat grew revenues from $6B to $10B+ demonstrating to the industry how to innovate in challenging circumstances. He is a recognized leader in the healthcare industry and serves on multiple related boards of healthcare industry giants and continues to advise major healthcare providers.
Names and titles as disclosed on SEC Form C, StartEngine. Bios and photos come from the platform campaign page and may be out of date.
Reg CF annual-report compliance
Filed 5 of 6 annual reports (FY2020–FY2025)
Reg CF issuers must file a Form C-AR each year until a Rule 202(b) termination trigger is met.
SEC filings
View all 17 filings on EDGAR- Form C-TRApr 30, 20260001830829-26-000004EDGAR
- Form C-ARApr 30, 20260001830829-26-000002EDGAR
- Form DJan 6, 20260001830829-26-000001EDGAR
- Form C-ARApr 23, 20250001830829-25-000002EDGAR
- Form C-ARApr 25, 20240001830829-24-000001EDGAR
- Form C-UDec 29, 20230001665160-23-002052EDGAR
- Form C/AOct 4, 20230001665160-23-001822EDGAR
- Form C-USep 28, 20230001665160-23-001798EDGAR
About this data. Figures are compiled from public sources — SEC EDGAR filings (Form C, C-AR, 1-A, 1-K) and funding-platform pages — and may be delayed, incomplete, or restated by the issuer. Financial statements are as reported by the issuer; each year is labeled with its assurance level (audited / reviewed / unaudited). A valuation cap is the conversion ceiling of a SAFE or convertible note, not an agreed company valuation; post-money figures are computed as pre-money plus amount raised and are not a traded price. Crowdonomics is not a broker-dealer, funding portal, or investment adviser; nothing here is investment advice or an offer to sell securities. Verify all figures against the linked EDGAR filings.