
Skunk Brothers Spirits Inc.
OperatingFood & Beverage · Stevenson, WA · Founded 2013
Get Skunk'd!
Financials
FY2017–FY2024 · from SEC filings · hover any figure for its sourceFigures as reported by the issuer in the filing shown on hover. Each year’s pill shows the assurance level of its filed statements — audited, reviewed (CPA review, less than an audit), or unaudited, as the filing’s own report or certification states it. A dashed pill marked * is inferred instead: the SEC minimum for an offering that size, which the issuer may have exceeded. No pill means we couldn’t tell. Headcount is the filing’s point-in-time count, not a year-end average. Manually corrected figures are marked “Corrected”.
Valuation over rounds
Pre-money — the valuation set before each round’s money came inBlue bars are the pre-money valuation the company stated for a priced round.
Share price over rounds
Disclosed sales come from the issuer's own filings (prior-offering lines, audited-statement notes) and are amount ÷ securities sold. A down round is a firm point more than 25 % below the previous firm point of the same share class on a comparable basis; the comparison ignores unverified and year-only lines.
Cap table
Principal holders% as the filing states it, Sep 1, 2022
- Scott Donoho3,337,500 Common Stock55.3%of company
Sold to the crowd
- Reg CF · Dec 20191,069,773 Common Stock at $1.00$1.1M· 2,481 investors
- Reg CF · Jun 202161,011 shares at $2.00$122K· 199 investors
From the company's SEC filings: share counts per class, each class's voting and conversion terms, and the holders of 20% or more that Form C requires (officers and 10%+ holders on Form 1-A). Filings name only large holders, so most owners — including crowd investors — are not listed, and a holder's percentage may be of its own class rather than of the whole company. Prices and crowd share counts are in today's share terms — adjusted for splits and conversions since they were sold. Hover a figure for its filing.
Fundraising history
Team
4 people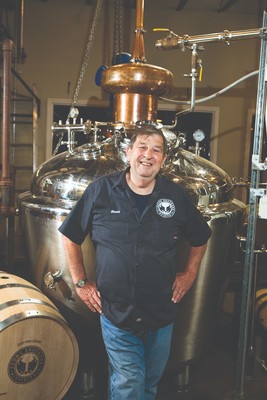
This is our Pops! We named the distillery after him an account of his antics. One time he was sent to get the dog in from out in the snow and tangled with a skunk instead. He wound up on the losing end of that deal, but he did aquire a shiny new nickname and a healthy respect for nature. In his own words- "Tomato juice doesn't work. Don't even bother." He is the life our the party in our tasting room and took over as an owner and head buttsaver in 2016. -Full time at Skunk Brothers
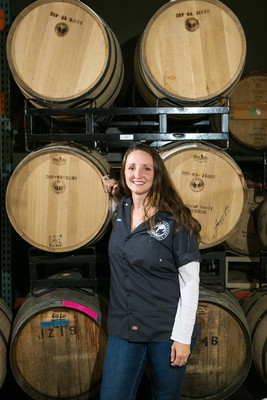
Jamie is a professional full time graphic designer and part-time distiller. Her formulas have made up some of our best selling products.
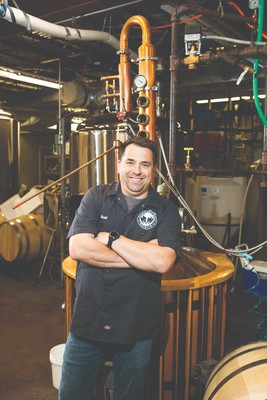
Scott is a retired U.S. Air Force and Air National Guard Fire Fighter. Between military and civil service he has been a Fire Fighter for 26 years. He is a self-taught distiller and had the idea for Skunk Brothers after a night of sampling "Shine" and having too much fun. He currently works full time as the CEO of Skunk Brothers but dedicates about 56 hours a week as a professional fire fighter as well.
Names and titles as disclosed on StartEngine, SEC Form C. Bios and photos come from the platform campaign page and may be out of date.
Reg CF annual-report compliance
Filed 6 of 7 annual reports (FY2019–FY2025)
Reg CF issuers must file a Form C-AR each year until a Rule 202(b) termination trigger is met.
SEC filings
View all 15 filings on EDGAR- Form C-ARApr 30, 20250001665160-25-000883EDGAR
- Form C-ARJul 30, 20240001665160-24-001121EDGAR
- Form C-ARMay 1, 20230001665160-23-001117EDGAR
- Form C-UOct 5, 20220001665160-22-002607EDGAR
- Form C-ARSep 1, 20220001665160-22-002343EDGAR
- Form C-UJan 6, 20220001665160-22-000048EDGAR
- Form C/ANov 29, 20210001665160-21-002108EDGAR
- Form C/AJun 10, 20210001665160-21-001027EDGAR
About this data. Figures are compiled from public sources — SEC EDGAR filings (Form C, C-AR, 1-A, 1-K) and funding-platform pages — and may be delayed, incomplete, or restated by the issuer. Financial statements are as reported by the issuer; each year is labeled with its assurance level (audited / reviewed / unaudited). A valuation cap is the conversion ceiling of a SAFE or convertible note, not an agreed company valuation; post-money figures are computed as pre-money plus amount raised and are not a traded price. Crowdonomics is not a broker-dealer, funding portal, or investment adviser; nothing here is investment advice or an offer to sell securities. Verify all figures against the linked EDGAR filings.