

Taste Labs
OperatingTaste Labs, Inc
Media & Entertainment · New York, NY · Founded 2018
AI Powered Personalized Recommendation
Financials
FY2017–FY2025 · from SEC filings · hover any figure for its sourceChart shows the most recent 8 fiscal years; 1 earlier year is in the table below.
Figures as reported by the issuer in the filing shown on hover. Each year’s pill shows the assurance level of its filed statements — audited, reviewed (CPA review, less than an audit), or unaudited, as the filing’s own report or certification states it. A dashed pill marked * is inferred instead: the SEC minimum for an offering that size, which the issuer may have exceeded. No pill means we couldn’t tell. Headcount is the filing’s point-in-time count, not a year-end average. Manually corrected figures are marked “Corrected”.
Valuation over rounds
Pre-money — the valuation set before each round’s money came inBlue bars are the pre-money valuation the company stated for a priced round.
Share price over rounds
Disclosed sales come from the issuer's own filings (prior-offering lines, audited-statement notes) and are amount ÷ securities sold. A down round is a firm point more than 25 % below the previous firm point of the same share class on a comparable basis; the comparison ignores unverified and year-only lines.
Cap table
Principal holders% as the filing states it, Apr 24, 2023
- John Lin3,000,000 Common Stock40.8%of company
- Justin Messina3,000,000 Common Stock40.8%of company
Sold to the crowd
- Reg CF · Apr 2019$366.7K· 117 investors
- Reg CF · Feb 2021496,971 shares at $0.69$342.9K· 360 investors
- Reg CF · May 2023130,642 shares at $1.09$142.4K· 124 investors
From the company's SEC filings: share counts per class, each class's voting and conversion terms, and the holders of 20% or more that Form C requires (officers and 10%+ holders on Form 1-A). Filings name only large holders, so most owners — including crowd investors — are not listed, and a holder's percentage may be of its own class rather than of the whole company. Prices and crowd share counts are in today's share terms — adjusted for splits and conversions since they were sold. Hover a figure for its filing.
Fundraising history
Team
9 people
John is a data-nerd with over 15 years of experience in analytical and marketing tech. Early in his career, John ran marketing programs for brands including Xbox, Starbucks, Neimen Marcus, and Essentia Water. During that time, he oversaw analytics for CRM programs that combined for +10MM customers. John also consulted for a long list of technology companies including Materialise, Upflex, Pentair, MadeClose, Drawbridge Networks (Acquired by Fortinet), and Cue.

Justin is a seasoned CTO with 16 years of experience as a full-stack engineer. Earlier in his career as the Head of Technology at Square Tomato, he managed the tech team and designed CRM automation processes for brands such as Starbucks and Corbis. He has also created a wide range of technologies including UGC-ready databases, merchant portals, e-commerce management, and social media platforms.

David Shilane brings 18 years of data science experience to his role at Taste Labs. He has worked on recommendation systems in social media, online dating, and EdTech. He's also a faculty member at Columbia University's Applied Analytics program. He holds degrees from Stanford University and a PhD from UC Berkeley. His role at Taste Labs involves algorithm refinement and data feature development.

Aaron Hoffman joined Taste Labs after a stint as EVP, Analytics and Statistics at Solstice Studios. He has experience in TV, media planning, and digital technologies, and was the founding architect of Magid’s EmotionalDNA® product. His role at Taste Labs focuses on B2B business and data product development.

Adam Weiss, former General Manager & SVP of Rakuten Marketing, brings 20 years of performance marketing experience to Taste Labs. He has been a keynote speaker at various advertising and marketing conferences. He advises Taste Labs on monetization strategy and lead-gen business development.

Bruce Friend is a seasoned data intelligence executive with over 30 years of experience. Most recently, he held dual roles at Screen Engine/ASI as Chief Product and Innovation Officer and Chief Data Monetization Officer. Previously, he boosted revenue at Ipsos OTX MediaCT's Insights practice and held senior positions at Sony, MTV, HBO, and Disney. At Taste Labs, Bruce guides our direction in data analytics and sales.

Kate Taylor brings 18 years of experience in marketing, events, PR, and brand strategy. She has worked in the FMCG, tech, and entertainment industries in LA and London. She specializes in event management, production, sponsorship, festival-organising, talent management, and PR. Kate heads PR at Taste Labs.

Ricky Solomon, with over 30 years of finance experience, advises Taste Labs on financial strategies and capital acquisition. He works with emerging companies on capital acquisition and allocation and is an active angel investor. He serves on the boards of Aspen Group and Ipsidy Inc.
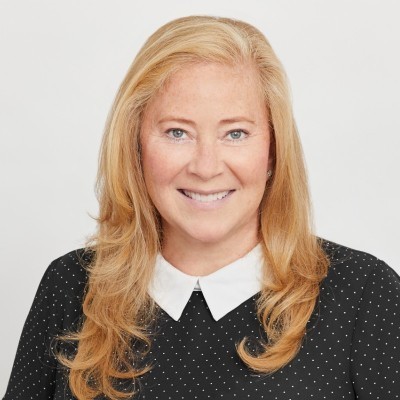
Shari Hardison has 30+ years in entertainment distribution. Past roles include Assistant Head of Sales at STX Entertainment, Head of Domestic Distribution at Solstice Studios, and positions at startups like Relativity Europa, Overture Films, and Focus Features. Her work includes films like Law Abiding Citizen, Traffic, and Lost in Translation. She leads licensing and distribution at Taste Labs.
Names and titles as disclosed on SEC Form C, StartEngine. Bios and photos come from the platform campaign page and may be out of date.
Reg CF annual-report compliance
Filed 7 of 7 annual reports (FY2019–FY2025)
Reg CF issuers must file a Form C-AR each year until a Rule 202(b) termination trigger is met.
SEC filings
View all 19 filings on EDGAR- Form C-ARApr 24, 20260001731197-26-000002EDGAR
- Form C-ARApr 9, 20250001665160-25-000546EDGAR
- Form C-ARApr 23, 20240001665160-24-000441EDGAR
- Form C-UNov 13, 20230001665160-23-001917EDGAR
- Form C/AOct 23, 20230001665160-23-001868EDGAR
- Form C/AAug 29, 20230001665160-23-001699EDGAR
- Form CJun 1, 20230001665160-23-001329EDGAR
- Form C-ARApr 24, 20230001665160-23-000755EDGAR
About this data. Figures are compiled from public sources — SEC EDGAR filings (Form C, C-AR, 1-A, 1-K) and funding-platform pages — and may be delayed, incomplete, or restated by the issuer. Financial statements are as reported by the issuer; each year is labeled with its assurance level (audited / reviewed / unaudited). A valuation cap is the conversion ceiling of a SAFE or convertible note, not an agreed company valuation; post-money figures are computed as pre-money plus amount raised and are not a traded price. Crowdonomics is not a broker-dealer, funding portal, or investment adviser; nothing here is investment advice or an offer to sell securities. Verify all figures against the linked EDGAR filings.