
Ternio BlockCard
OperatingTernio, LLC
Fintech · Crypto · Alpharetta, GA · Founded 2018
The platform to move money instantly
Financials
FY2017–FY2021 · from SEC filings · hover any figure for its sourceFigures as reported by the issuer in the filing shown on hover. Each year’s pill shows the assurance level of its filed statements — audited, reviewed (CPA review, less than an audit), or unaudited, as the filing’s own report or certification states it. A dashed pill marked * is inferred instead: the SEC minimum for an offering that size, which the issuer may have exceeded. No pill means we couldn’t tell. Headcount is the filing’s point-in-time count, not a year-end average. Manually corrected figures are marked “Corrected”.
Valuation over rounds
Pre-money — the valuation set before each round’s money came inDotted grey bars are our estimate for rounds that didn't state one: the round's share price × the shares outstanding in its filings. Same measure as blue, but rougher. Dashed amber bars are a SAFE or convertible note's valuation cap — the most it converts at, not what the company is worth, so don't compare them with the other bars.
Share price over rounds
Disclosed sales come from the issuer's own filings (prior-offering lines, audited-statement notes) and are amount ÷ securities sold. A down round is a firm point more than 25 % below the previous firm point of the same share class on a comparable basis; the comparison ignores unverified and year-only lines.
Cap table
Share counts as of Nov 25, 2022| Class | Outstanding | Votes / share | Share of total | Votes | Last price |
|---|---|---|---|---|---|
| Preferredpreferred | 4,817,200 | — | 2.38% | 100.0% | — |
| Class B | 197,182,800 | none | 97.6% | 0% | — |
| Total | 202,000,000 | 100% | 100% |
Shares outstanding over timein today's share terms
Principal holders% as the filing states it, Nov 25, 2022
- Grassroots Impact, LLC20 Class A Common Stock48.8%of company
- Grassroots Impact, LLC98,591,420 Class B Common Stock48.8%of company
- Ian Kane20 Class A Common Stock48.8%of company
- Ian Kane98,591,420 Class B Common Stock48.8%of company
- Mark Morales4,817,200 Series A Preferred Stock2.4%of company
Sold to the crowd
- Reg CF · Nov 2019Crowd SAFE$1.1M· 3,719 investors
- Reg CF · Feb 2022Crowd SAFE$2.2M· 2,935 investors
- Reg CF · Jan 2023Class B Common Stock$115.4K· 215 investors
From the company's SEC filings: share counts per class, each class's voting and conversion terms, and the holders of 20% or more that Form C requires (officers and 10%+ holders on Form 1-A). Filings name only large holders, so most owners — including crowd investors — are not listed, and a holder's percentage may be of its own class rather than of the whole company. Prices and crowd share counts are in today's share terms — adjusted for splits and conversions since they were sold. Hover a figure for its filing.
Fundraising history
Team
6 people
When I was 17 years old - I was homeless. I lived out of my car, worked two jobs and found a way to graduate high school. 20 years later - I was able to be in a position to work for myself. I now own several businesses and hope to make a difference for others over my next 20. I'm a highly political person with an avid interest in geopolitics, history and business. I'm more concerned with doing what's right than what's popular.

I have worked in technology & digital media for over 15 years with a heavy focus on business development, sales, and strategy. My career started as the 1st employee in a media startup which grew into a $50mm a year business during my tenure. I had the opportunity to work in both early-stage and mature organizations, be a part of acquisitions on the buy and sell side, and drive go-to-market strategy for various data and media products. As an advisor and investor in other ad tech companies, I always look to create value and continually broaden my knowledge of the ever-changing landscape. My background enables me to bring unique insight and experience to the next set of challenges I face.

Mr. Ballou oversees the development of Unbanked's core products. BlockCard is Unbanked’s US-based cryptocurrency debit card that lets you spend your crypto anywhere. Mr. Ballou is a seasoned developer that has been custom-building websites and applications for over two decades. Mr. Ballou has five years of fast-paced development experience at two leading design and development agencies in Charlotte followed by an additional six years working on building and launching startups for some amazing companies. Most notable is his work as a lead developer for .CO Internet. Briefly following a successful Super Bowl ad launch with partner GoDaddy, .CO was sold to Neustar for $109M in 2014. Mr. Ballou has owned and operated his own web development consultancy since 2012. Since then, Corey has had the pleasure of working with several successful startups to build out their custom web applications.
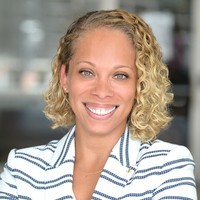
I have worked in Fintech, Publishing and Digital Media for over 15 years. I've had the benefit of working for both mature companies and startups with a heavy focus on HR, Operations, Business Development, & Sales. Recently I have allocated some time on advising startups in a few categories. I always seek a challenge and the opportunity to learn something new. Whether it is HR, publishing, digital media or even dabbling in cryptocurrency - I am always open to connecting with those interested in building something new.

Keith Johnson is a disciplined and results driven Business Partner and engineer with demonstrated achievement in product management, strategy, and business development. Mr. Johnson has led both hardware, software, and managed services product teams with annual revenue in excess of $100M dollars. Keith has proven credibility to create bottom-line oriented product roadmaps and business plans.

Mark Morales was born and raised in Austin, Texas. He began his career as an Assistant District Attorney after graduating from the Texas Tech School of Law in 2001. In his lengthy career, he has been honored by many awards and recognitions. Mark was nominated by his peers and then selected by Thompson Reuters to be featured in Texas Monthly magazine as a SUPER LAWYER in 2016. Mr. Morales has spent the majority of his career, defending citizens accused of crimes. For the last 5 years, Mr. Morales has been a self-employed attorney under Mark Morales and Associates, which is his principal business.
Names and titles as disclosed on SEC Form C, StartEngine. Bios and photos come from the platform campaign page and may be out of date.
Reg CF annual-report compliance
Filed 1 of 7 annual reports (FY2019–FY2025)
Missing: 2019, 2021, 2022, 2023, 2024, 2025
Reg CF issuers must file a Form C-AR each year until a Rule 202(b) termination trigger is met.
SEC filings
View all 19 filings on EDGAR- Form C-UApr 18, 20230001665160-23-000651EDGAR
- Form CJan 4, 20230001665160-23-000020EDGAR
- Form 1-A/ANov 25, 20220001553350-22-000964EDGAR
- Form C-USep 6, 20220001730695-22-000008EDGAR
- Form 1-A/AJul 5, 20220001553350-22-000586EDGAR
- Form 1-A/AMay 20, 20220001553350-22-000493EDGAR
- Form C/AApr 26, 20220001730695-22-000007EDGAR
- Form C/AApr 8, 20220001619790-22-000003EDGAR
About this data. Figures are compiled from public sources — SEC EDGAR filings (Form C, C-AR, 1-A, 1-K) and funding-platform pages — and may be delayed, incomplete, or restated by the issuer. Financial statements are as reported by the issuer; each year is labeled with its assurance level (audited / reviewed / unaudited). A valuation cap is the conversion ceiling of a SAFE or convertible note, not an agreed company valuation; post-money figures are computed as pre-money plus amount raised and are not a traded price. Crowdonomics is not a broker-dealer, funding portal, or investment adviser; nothing here is investment advice or an offer to sell securities. Verify all figures against the linked EDGAR filings.