

Thirty Three Threads
OperatingThirty Three Threads, Inc.
Beauty & Fashion · Vista, CA · Founded 2004
A premium athleisure collective
Financials
FY2018–FY2025 · from SEC filings · hover any figure for its sourceFigures as reported by the issuer in the filing shown on hover. Each year’s pill shows the assurance level of its filed statements — audited, reviewed (CPA review, less than an audit), or unaudited, as the filing’s own report or certification states it. A dashed pill marked * is inferred instead: the SEC minimum for an offering that size, which the issuer may have exceeded. No pill means we couldn’t tell. Headcount is the filing’s point-in-time count, not a year-end average. Manually corrected figures are marked “Corrected”.
Valuation over rounds
Pre-money — the valuation set before each round’s money came inBlue bars are the pre-money valuation the company stated for a priced round. Dotted grey bars are our estimate for rounds that didn't state one: the round's share price × the shares outstanding in its filings. Same measure as blue, but rougher.
Share price over rounds
Disclosed sales come from the issuer's own filings (prior-offering lines, audited-statement notes) and are amount ÷ securities sold. A down round is a firm point more than 25 % below the previous firm point of the same share class on a comparable basis; the comparison ignores unverified and year-only lines.
Cap table
Share counts as of Jun 30, 2021| Class | Outstanding | Votes / share | Share of total | Last price |
|---|---|---|---|---|
| Common stock | 13,399,214 | — | 100.0% | — |
Sold to the crowd
- Reg CF · Feb 2021347,376 shares at $2.00$694.8K· 513 investors
From the company's SEC filings: share counts per class, each class's voting and conversion terms, and the holders of 20% or more that Form C requires (officers and 10%+ holders on Form 1-A). Filings name only large holders, so most owners — including crowd investors — are not listed, and a holder's percentage may be of its own class rather than of the whole company. Prices and crowd share counts are in today's share terms — adjusted for splits and conversions since they were sold. Hover a figure for its filing.
Fundraising history
Team
10 people
With over 20 years of experience in the fitness, sports and apparel industries (including Oakley, Gap Inc., Speedo, L.L. Bean, Lands’ End and a 14-year tenure at Nike in both Global and Regional key leadership roles), Gill brings both a wealth of experience and a powerful strategic vision to Thirty Three Threads. She is a brand builder, growth visionary, and true leader in the women’s and men’s athleisure, clothing and accessory sectors. Her ability to define a global product vision that leverages trends while adapting to market conditions has repeatedly delivered profitability. As a global business leader with an unparalleled depth of experience in the challenges and opportunities of the apparel industry, Gill is uniquely positioned to help take Thirty Three Threads to its next stage of expansion. Prior to joining Thirty Three Threads Gill held the position of EVP Chief Merchandising Officer and Head of International for Lands’ End PLC, an American Women’s, Men’s, Kids clothing, footwear, accessory and home décor direct to consumer retailer.

Barry has had over 30 years of executive experience in various industries including consumer electronics, eyewear, and luxury goods. He has held executive positions with Kaypro (KMG). (VP Operations), Professional Technologies (COO), Vision Technologies (COO), Spy Optic (President and CEO), where he took the company public, and Chrome Hearts Eyewear (General Manager). Barry joined Thirty Three Threads on a consulting basis in 2011 and full time in 2013.

Brian is a successful Global COO and branded business leader with compelling experiences at Fox Racing Oakley, Reebok and Adidas. He spent several years as an Expat in Asia building highly efficient global supply chain and manufacturing systems. Experienced with revenues ranging from $300M to well over $5 billion Brian is a seasoned business leader in both the private and public sector. His exceptional ability to drive innovation, grow revenue and EBITDA to create both shareholder and stakeholder value is of immense worth to Thirty Three Threads as they embark on their next chapter of growth. Prior to joining Thirty Three Threads Brian held the position of Chief Operating Officer with Fox Racing. He also served as President of ProStairs Fitness from March 1, 2020 through October 1, 2020, and currently serves as a member of the Board of Advisors.

Matt Weaber joined Thirty Three Threads in 2016 and is currently the VP of Sales. Matt works closely with the President and CEO to drive domestic sales, and optimize wholesale distribution and expansion into adjacent markets. Matt was the Global Director of Sales at prAna from 2001 – 2016, when the company’s global wholesale business grew from $3M to greater than $85M. During this time, Matt also consulted with brands in industries including outdoor, sporting goods, active apparel, and home goods. This work was primarily focused on sales strategy, organizational go-to-market plans, team structure, online strategy, and omni-channel optimization. Matt has also acted as an advisor to buying groups such as Grassroots Outdoor Alliance. Matt earned a bachelor’s degree in Business Management in 2001. Matt Weaber has an at will employment agreement with the Company with both base salary and bonus based on achieving revenue targets.

Brenda is a California CPA with over 30 years of experience in accounting, auditing and financial analysis. Before joining the Company, she was a senior financial analyst with an international renewable energy company. She started her career at PWC then spent several years as an audit manager at a regional CPA firm. She has also worked as an accounting manager/controller in the finance and manufacturing sectors.

Danielle is the latest outstanding talent to join the team at Thirty Three Threads, joining us in March 2021 as our Global Merchandising Director. Over the past decade she has held various leadership roles, managing both established multi-million dollar omni-channel divisions and internal start up e-commerce businesses. No matter the size of the business, her consistent focus has always been the same; to drive results. Those results have been proven with brands such as Gap, Banana Republic, Anne Taylor LOFT, and more. In addition, she has developed multiple innovative product strategies around sustainability and inclusivity for leading global brands. Whether it’s building high-performing teams, creating best-in-class products, or driving top line growth and profitability, Danielle’s history of growing product categories in competitive environments combined with her e-commerce experience makes her a valuable addition to our team as we continue to grow. Prior to Thirty Three Threads Danielle was previously a global merchandising leader with the Gap Brand where she led the brand’s fastest growing division (activewear and body) to the highest online sales contribution of Women’s through expanded product offering and site enhancements driving conversion and traffic.
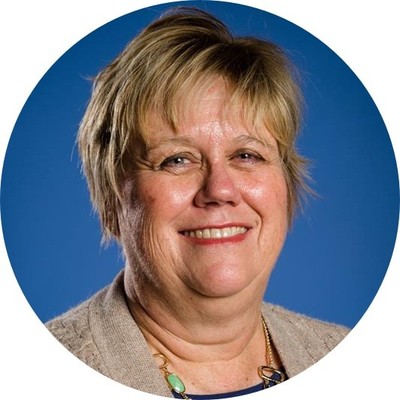
DeeDee Wilson started her career as a CPA with Price Waterhouse. DeeDee then joined the Coca-Cola Company before being recruited to Nike. During her 13 years there, she served in various roles, including Chief Internal Auditor, Head of Global Financial Planning, and VP/CFO of Nike’s two largest divisions (EMEA and USA). DeeDee was a charter member of Nike’s Women’s Leadership Council, where she started a program for emerging female executives. After being named one of CFO magazine’s “Top 25 women CFOs to Watch in 2008,” DeeDee left Nike to become CFO of private-equity backed, fashion retailer, Aritzia. She then completed several assignments in senior finance roles at multinational consumer goods companies before focusing her attention in the nonprofit space, where she is currently EVP, Finance & Administration at a large national non-profit. She is an investor and board advisor in two start-up socially responsible enterprises and has held several nonprofit board seats.

Greg is the co-founder and managing director of Black Oak Capital. In this role, he leads overall strategy formulation and fundraising while overseeing deal sourcing, due diligence, and new investments. Black Oak has invested over $100 million in senior debt, mezzanine debt, and preferred equity financings. Prior to Black Oak, Greg was a founder and managing director at Seare Marriott & Co, a middle-market investment banking firm with offices in Salt Lake City, Utah, and Richmond, Virginia. Previously, Greg worked at BB&T and Virginia Capital Markets in Richmond, Virginia where he had over $2 billion of transaction experience spanning multiple industries. Greg received an MBA and MPP from William & Mary (where he was a Jefferson Fellow) and a BS in Political Science from the University of Utah. Mr. Seare was an active Scout Leader for more than a decade and serves as a board member for the Guadalupe Charter School.

In 2004, Joe and his wife, Christina, founded the Company in their garage and began to develop the ToeSox brand, its product and essentially created the fitness grip-sock industry. Joe led the Company as CEO until November 2019, during which time the company became one of the leaders in grip sock industry with numerous patents and technologies that he personally developed. Joe currently provides company oversight as Chairman of the Board. Joe started his career as a sales rep for GAF, the largest manufacturer of Roofing technology in the US with over $3 Billion in annual revenue. Joe held the position of Regional Sales Manager for 7 years. Joe received his Bachelor of Sciences degree in Biology from San Diego State University in 1994.
Show 1 more personShow fewer

Julie DeAnda's career includes design, technical design, product development, collection merchandising, global sourcing and production in the USA, Asia and European territories. She has been involved with some of the most influential apparel, accessory and footwear brands in several fashion markets and has worked side by side with the most influential visionaries, artisans and talented tastemakers in the fashion industry. Julie DeAnda joined Thirty Three Threads in 2012 as a consultant. Since then she has been committed to bringing innovative designs and technologies to merge the vision and brand strategy for the brands by designing, developing and executing complete collections with an intentional focus on bringing a luxurious quality and compilation of aspirational designs merchandising unexpected and exceptional raw materials to the premium markets. In 2017, Julie became the Company’s Director of Product with the intention of continuing with progressive and innovative designs and newly, product development management, sourcing new raw material technologies and chain supply procurement while leading the product teams toward achieving the Company's next milestones and goals.
Names and titles as disclosed on SEC Form C, StartEngine. Bios and photos come from the platform campaign page and may be out of date.
Reg CF annual-report compliance
Filed 6 of 6 annual reports (FY2020–FY2025)
Reg CF issuers must file a Form C-AR each year until a Rule 202(b) termination trigger is met.
SEC filings
View all 16 filings on EDGAR- Form C-AROct 28, 20250001832217-25-000005EDGAR
- Form C-AR/ANov 12, 20240001832217-24-000002EDGAR
- Form C-AROct 29, 20240001832217-24-000001EDGAR
- Form DDec 1, 20230001832217-23-000006EDGAR
- Form C-AROct 31, 20230001832217-23-000003EDGAR
- Form C-AR/AOct 31, 20230001832217-23-000004EDGAR
- Form C-AROct 30, 20230001832217-23-000002EDGAR
- Form C-AROct 27, 20220001644600-22-000129EDGAR
About this data. Figures are compiled from public sources — SEC EDGAR filings (Form C, C-AR, 1-A, 1-K) and funding-platform pages — and may be delayed, incomplete, or restated by the issuer. Financial statements are as reported by the issuer; each year is labeled with its assurance level (audited / reviewed / unaudited). A valuation cap is the conversion ceiling of a SAFE or convertible note, not an agreed company valuation; post-money figures are computed as pre-money plus amount raised and are not a traded price. Crowdonomics is not a broker-dealer, funding portal, or investment adviser; nothing here is investment advice or an offer to sell securities. Verify all figures against the linked EDGAR filings.