

Trella Technologies, Inc
OperatingTrella Technologies LLC
Agriculture · Bourne, MA
Grow tall plants in small spaces. Innovative and Sustainable Solutions For The Indoor and Urban Farming Industries An Automated Horizontal Plant-Training System to Maximize Space & Output
Financials
FY2016–FY2024 · from SEC filings · hover any figure for its sourceChart shows the most recent 8 fiscal years; 1 earlier year is in the table below.
Figures as reported by the issuer in the filing shown on hover. Each year’s pill shows the assurance level of its filed statements — audited, reviewed (CPA review, less than an audit), or unaudited, as the filing’s own report or certification states it. A dashed pill marked * is inferred instead: the SEC minimum for an offering that size, which the issuer may have exceeded. No pill means we couldn’t tell. Headcount is the filing’s point-in-time count, not a year-end average. Manually corrected figures are marked “Corrected”.
Valuation over rounds
Valuation caps on SAFE / convertible note roundsDashed amber bars are a SAFE or convertible note's valuation cap — the most it converts at, not what the company is worth.
Fundraising history
Team
11 people
Aja is an entrepreneur, team-leader, and cannabis advocate with over 15 years of experience in the engineering industry. She is a mechanical engineer and graduated cum laude from Northeastern University. She cut her teeth professionally as an engineering consultant and specialist, working in natural catastrophe risk engineering, and by 2011 started her first entrepreneurial businesses. Ms. Atwood is also a founding member of ELEVATE NE, an organization created to support the New England cannabis industry's need for education, advocacy and networking in a professional and inviting atmosphere. She's also a proud supporter of EforAll (Entrepreneurship for All), the Massachusetts Recreational Consumer Council (MRCC) and the Cannabis Community Care and Research Network (C3RN).

"Dre" has more than 15 years of experience engineering a variety of devices, primarily for the medical industry. He currently has 39 patents pending, including 24 issued patents. A seasoned manager, he led in-house engineering teams, design firms, and consultants through the process of problem identification, solution design, proof of concept, product manufacturing, and introduction to market. Dre was part of the founding team at Cambridge Endoscopic Devices, Inc. where he developed 29 products the company successfully brought to market. He attended Northeastern University's Mechanical Engineering Technology program.

Andrew Keener is a Software Engineer specializing in Product Design and Development of IoT devices. He has worked in the field for the last 7 years and helped multiple startups along the way. His company: Keen Software Solutions develops custom hardware and software to meet clients needs.
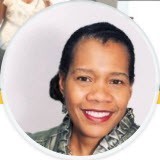
Angela Pitter is CEO of LiveWire Collaborative. She is a digital marketing strategist known for building comprehensive solutions that expand and strengthen customer engagements. Incorporating her project management expertise, she provides clients a "roadmap" to address the areas that are weak, improve those that are good, create new opportunities and to chart a course to expand your digital footprint and brand. As a professional speaker, she was recently featured on Chronicle’s, WCVB TV social media segment. Additionally, Angela brings over 20 years of experience in high-tech leading global teams and products to the market. She holds an M.S. in Administration and B.S. in Computer Engineering.


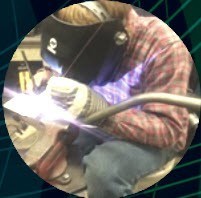
Jeff Benning is the Lead Engineer and founder of Designhawk Innovations. He plays a crucial role on the engineering design team for the TrellaGro LST product. Jeff began his career working in automotive shops and machine shops before pursuing a mechanical engineering degree from the University of Illinois at Chicago. After graduating, he began designing robotics and automated machinery for factories in Chicago. He then started Designhawk Innovations where he helps tech companies design and build their products. He is passionate about working on smart technology and promoting the use of automation.

Jen is self-employed senior design professional with a wealth of industrial design, user experience and GUI development experience in medical, consumer and industrial markets. She incorporates a user-centered design approach to develop thoughtful, compelling and relevant design solutions for her clients. Jen partners with clients and groups to develop appropriate solutions to define the right problem to solve, create a compelling design and user experience, and ensure translation and delivery of that intent to the user. To realize a solution that delights a user, makes your client smile, and makes a difference is what it's all about.

Matt is a mechanical engineer with 11 years of experience building a diverse background including; large semiconductor FAB construction project management, world class rally car design engineering, superconductor manufacturing tool design, engineering consulting, and extensive experience as the primary client facing engineering representative serving many fortune 500 clients
Show 2 more peopleShow fewer
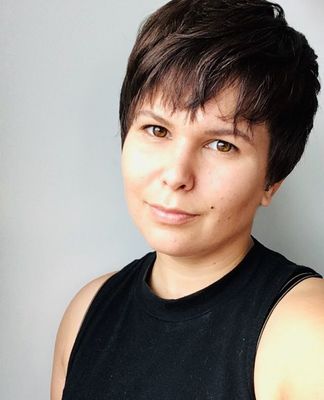
Nina is an operations professional serving small business owners in the cannabis, technology and herbalism sectors. With six years of experience in higher and continuing education management, Nina’s focus is on strategy development, project management, community engagement management, and customer relations management. She supports Trella with organizational and project management, process improvement, strategic goal tracking, and partnership management. She has a BA and MA in Linguistics from Boston University.
Names and titles as disclosed on SEC Form C, StartEngine. Bios and photos come from the platform campaign page and may be out of date.
Reg CF annual-report compliance
Filed 6 of 8 annual reports (FY2018–FY2025)
Reg CF issuers must file a Form C-AR each year until a Rule 202(b) termination trigger is met.
SEC filings
View all 24 filings on EDGAR- Form C-TROct 29, 20250001096906-25-001719EDGAR
- Form C-ARApr 29, 20250001096906-25-000616EDGAR
- Form C-ARApr 26, 20240001096906-24-000949EDGAR
- Form C-ARApr 28, 20230001096906-23-000932EDGAR
- Form C-ARJun 8, 20220001096906-22-001355EDGAR
- Form CMar 31, 20220001670254-22-000271EDGAR
- Form C-AR/ADec 30, 20210001665160-21-002407EDGAR
- Form C-UJul 19, 20210001665160-21-001265EDGAR
About this data. Figures are compiled from public sources — SEC EDGAR filings (Form C, C-AR, 1-A, 1-K) and funding-platform pages — and may be delayed, incomplete, or restated by the issuer. Financial statements are as reported by the issuer; each year is labeled with its assurance level (audited / reviewed / unaudited). A valuation cap is the conversion ceiling of a SAFE or convertible note, not an agreed company valuation; post-money figures are computed as pre-money plus amount raised and are not a traded price. Crowdonomics is not a broker-dealer, funding portal, or investment adviser; nothing here is investment advice or an offer to sell securities. Verify all figures against the linked EDGAR filings.