

WeatherFlow-Tempest, Inc.
OperatingIndustrial & Manufacturing · Scotts Valley, DE · Founded 2018
Controlling the cost of weather
Financials
FY2019–FY2025 · from SEC filings · hover any figure for its sourceFigures as reported by the issuer in the filing shown on hover. Each year’s pill shows the assurance level of its filed statements — audited, reviewed (CPA review, less than an audit), or unaudited, as the filing’s own report or certification states it. A dashed pill marked * is inferred instead: the SEC minimum for an offering that size, which the issuer may have exceeded. No pill means we couldn’t tell. Headcount is the filing’s point-in-time count, not a year-end average. Manually corrected figures are marked “Corrected”.
Valuation over rounds
Pre-money — the valuation set before each round’s money came inBlue bars are the pre-money valuation the company stated for a priced round.
Share price over rounds
Disclosed sales come from the issuer's own filings (prior-offering lines, audited-statement notes) and are amount ÷ securities sold. A down round is a firm point more than 25 % below the previous firm point of the same share class on a comparable basis; the comparison ignores unverified and year-only lines.
Cap table
Principal holders% as the filing states it, Jul 31, 2026
- Daniel26.3%of company
Sold to the crowd
- Reg CF · Nov 2021799,363 shares at $2.50$2M· 1,363 investors
- Reg CF · Jan 2023579,972 shares at $2.75$1.6M· 1,097 investors
- Reg CF · Dec 2024407,616 shares at $3.00$1.2M· 983 investors
From the company's SEC filings: share counts per class, each class's voting and conversion terms, and the holders of 20% or more that Form C requires (officers and 10%+ holders on Form 1-A). Filings name only large holders, so most owners — including crowd investors — are not listed, and a holder's percentage may be of its own class rather than of the whole company. Prices and crowd share counts are in today's share terms — adjusted for splits and conversions since they were sold. Hover a figure for its filing.
Fundraising history
Team
8 people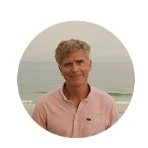
After early career years in finance, Buck has many years experience building and selling start-ups in a variety of industries. He has been involved in the weather and environmental space since 2000, when he co-founded WFn Holdings. He also co-founded environmental data aggregator Synoptic Data PBC in 2012. Buck holds a BA in Mathematics from Middlebury College and MBA from Stanford University. Against his will, he is occasionally featured in our marketing videos, since hiring someone who can act is too expensive.
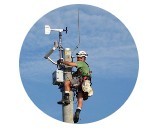
Phil co-founded WeatherFlow-Tempest and is currently a valuable member of our Board of Directors. He designed the patented Tempest sonic anemometer and has actively contributed to the design of coming products. Phil has a full-time role serving as President/COO of WFn Holdings, an affiliate company that provides us key industrial grade weather data. He has 30 years of experience designing and maintaining weather station networks, after starting his career designing missile systems at Lockheed. He completed coursework at MIT and holds a BS from Harvard.

Starting his career at General Dynamics, David has since been involved with several successful start-ups. His entrepreneurial streak began with a venture formed during graduate school. David has strong expertise in both hardware and software, with a BS in Engineering from the University of Florida and an MS in Engineering from the University of California. An avid wind & water sportsman, his passion around creating better weather data was born of a selfish desire to get more time on the water (saving the world is just icing on the cake). David is affectionately known here as Pooh Bear for his relentless optimism and likeability while driving his team hard.

A New Zealand native, career Atmospheric Scientist and avid outdoorsman, Marty leads an energetic team of Ph.D. atmospheric scientists and engineers (the “Drs Office”) developing WeatherFlow-Tempest’s Nearcast Technology™. He has spent most of his career in the US, leading numerical weather research and executing weather modeling operationally, including a stint running his own firm. He counts NASA, the US DoD, and many other research and commercial programs across the globe as former employers and clients. Marty earned his bachelor and doctorate degrees in Chemical Engineering from the University of Canterbury, and constantly touts the superiority of New Zealand in “very important” sports like sailing and rugby.
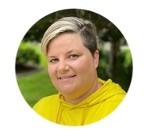
After starting her career at United Parcel Service and the US Social Security Administration, Corrine quickly became a star programmer at WFn Holdings. She was an obvious choice for her current role as we founded WeatherFlow-Tempest. With a Masters degree in Computer Science and a flair for design, Corrine oversees the development & maintenance of our apps, SaaS tools and API with grace and genius (not to mention gratitude for no longer working for the SSA!).

Michele simply makes all our marketing communications go. As she has done for several previous entities, she expertly injects highly technical products and technology with life and personality to make them relatable for a variety of audiences. Her average week at WeatherFlow-Tempest includes a variety of PR planning, content strategy and creation, copyediting, ad execution and analysis, project management, and herding C-suite executives. She ruined the curve while getting her BA from the University of North Carolina, and she has continued demanding a lot from herself and others ever since.

A trusted strategic advisor and member of the Board of Directors, Michael has more than 20 years of experience leading and consulting successful start-ups. From early years as an investment banker to successful start-up executive to venture capitalist, and now a private investor, Michael is an invaluable asset with a wealth of knowledge and expertise. (Which he provides when ocean conditions don't quite support his passion for riding waves.) Michael holds a BS from Harvard and an MBA from Stanford University.
Names and titles as disclosed on SEC Form C, StartEngine. Bios and photos come from the platform campaign page and may be out of date.
Reg CF annual-report compliance
Filed 5 of 5 annual reports (FY2021–FY2025)
Reg CF issuers must file a Form C-AR each year until a Rule 202(b) termination trigger is met.
SEC filings
View all 18 filings on EDGAR- Form C-ARJul 31, 20260001887700-26-000001EDGAR
- Form C/ADec 22, 20250001887700-25-000009EDGAR
- Form CDec 11, 20250001887700-25-000007EDGAR
- Form C-ARDec 5, 20250001887700-25-000004EDGAR
- Form C-UFeb 25, 20250001665160-25-000313EDGAR
- Form C/AJan 22, 20250001665160-25-000105EDGAR
- Form CDec 16, 20240001665160-24-001826EDGAR
- Form C-UDec 16, 20240001665160-24-001811EDGAR
About this data. Figures are compiled from public sources — SEC EDGAR filings (Form C, C-AR, 1-A, 1-K) and funding-platform pages — and may be delayed, incomplete, or restated by the issuer. Financial statements are as reported by the issuer; each year is labeled with its assurance level (audited / reviewed / unaudited). A valuation cap is the conversion ceiling of a SAFE or convertible note, not an agreed company valuation; post-money figures are computed as pre-money plus amount raised and are not a traded price. Crowdonomics is not a broker-dealer, funding portal, or investment adviser; nothing here is investment advice or an offer to sell securities. Verify all figures against the linked EDGAR filings.