

Whooshh Innovations Inc.
Raising nowOperatingRichard Guarino
Energy & Cleantech · Seattle, WA · Founded 2007
Fish passage solutions
This company has an open fundraising round.
Financials
FY2019–FY2025 · from SEC filings · hover any figure for its sourceFigures as reported by the issuer in the filing shown on hover. Each year’s pill shows the assurance level of its filed statements — audited, reviewed (CPA review, less than an audit), or unaudited, as the filing’s own report or certification states it. A dashed pill marked * is inferred instead: the SEC minimum for an offering that size, which the issuer may have exceeded. No pill means we couldn’t tell. Headcount is the filing’s point-in-time count, not a year-end average. Manually corrected figures are marked “Corrected”.
Valuation over rounds
Pre-money — the valuation set before each round’s money came inBlue bars are the pre-money valuation the company stated for a priced round.
Share price over rounds
Disclosed sales come from the issuer's own filings (prior-offering lines, audited-statement notes) and are amount ÷ securities sold. A down round is a firm point more than 25 % below the previous firm point of the same share class on a comparable basis; the comparison ignores unverified and year-only lines.
Cap table
Principal holders% as the filing states it, Jul 19, 2023
- Stette Invest AS5,780,416 Common Stock8.23%of
- Vincent Bryan Jr.5,545,360 Common Stock7.9%of
Sold to the crowd
- Reg CF · Apr 2021918,095 shares at $1.50$1.4M· 1,019 investors
- Reg CF · Oct 202289,900 shares at $3.00$269.7K· 165 investors
- Reg CF · Nov 2023131,808 shares at $1.50$197.7K
- Reg CF · Mar 202631,397 Common Stock at $2.00$62.8K
From the company's SEC filings: share counts per class, each class's voting and conversion terms, and the holders of 20% or more that Form C requires (officers and 10%+ holders on Form 1-A). Filings name only large holders, so most owners — including crowd investors — are not listed, and a holder's percentage may be of its own class rather than of the whole company. Prices and crowd share counts are in today's share terms — adjusted for splits and conversions since they were sold. Hover a figure for its filing.
Fundraising history
Team
11 people
Mr. Bryan, is a founder of and the CEO of Whooshh Innovations Inc. He is responsible for the vision and strategic direction of the Company and its product offerings, the management of the executive team, the hiring decision of key employees, the capital and financing activities of the Company and the government and investor relations. His prior executive experience includes Director at Adobe Systems Inc., and CEO/COO of Montage Management LLC. He has a BA in Political Science and Economics; Juris Doctor in Law; and Masters in Transnational Business Transactions

Dr. Bryan is a skilled research scientist, leader and operations manager with direct experience crossing multiple disciples including biology, engineering, environmental science, cancer research, molecular biology, basic research, discovery and development and systems biology research. Dr. Bryan was the lead senior research scientist for the human papillomavirus (HPV) vaccine licensed in 2006. After leaving Merck, she was the principal research scientist in the Microbiology Department of the University of Washington. Dr. Bryan is well published with 89 published peer-reviewed manuscripts and is an inventor on six issued patents. Dr. Bryan received her Ph.D. from Indiana University School of Medicine in 1998 from the Department of Microbiology and Immunology with a focus in molecular virology.

Siao Ling Kok is currently our VP of Finance. She has served in that position for almost a year, from May 2020 to the present date. Prior to joining us, she was the Controller for MIControls Inc, from April 2012 to May 2019, and oversaw the company’s accounting, budgeting and financial planning and analysis . MIControls Inc was acquired by Kele Inc in June 2018. In that position she was responsible for the planning and preparation leading to the sale of the company, and transition of accounting systems during and after the acquisition. She is a Certified Public Accountant and holds an M.B.A. degree in Financial Management from City University.
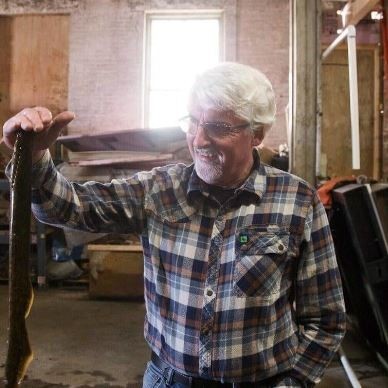
Steve Dearden is a Vice President for Whooshh Innovations. Steve works with dam owners and operators, agencies and tribes to formulate and propose solutions for fish transport. Most recently he managed a large fish rescue operation on the Fraser River in Canada involving thousands of migrating salmon. Steve holds Bachelors and Doctorate degrees in Electrical Engineering and Computer Science from Reading University, UK.

Retired. Director, fleet operations of HRC Trucks.
CEO, Stonebridge Securities LLC Investment Banking, & Consulting
Show 2 more peopleShow fewer
Chairman and CMO PreActive Technologies Inc. Specialty medical device technology company
Names and titles as disclosed on SEC Form C, StartEngine. Bios and photos come from the platform campaign page and may be out of date.
Reg CF annual-report compliance
Filed 5 of 5 annual reports (FY2021–FY2025)
Reg CF issuers must file a Form C-AR each year until a Rule 202(b) termination trigger is met.
SEC filings
View all 24 filings on EDGAR- Form C/AMay 22, 20260001813227-26-000004EDGAR
- Form C-ARApr 30, 20260001813227-26-000003EDGAR
- Form CMar 10, 20260001813227-26-000002EDGAR
- Form C-ARJul 14, 20250002070024-25-000003EDGAR
- Form C-UMay 14, 20240001644600-24-000056EDGAR
- Form C-ARMay 13, 20240001644600-24-000055EDGAR
- Form C-UNov 14, 20230001644600-23-000186EDGAR
- Form C/ANov 9, 20230001644600-23-000185EDGAR
About this data. Figures are compiled from public sources — SEC EDGAR filings (Form C, C-AR, 1-A, 1-K) and funding-platform pages — and may be delayed, incomplete, or restated by the issuer. Financial statements are as reported by the issuer; each year is labeled with its assurance level (audited / reviewed / unaudited). A valuation cap is the conversion ceiling of a SAFE or convertible note, not an agreed company valuation; post-money figures are computed as pre-money plus amount raised and are not a traded price. Crowdonomics is not a broker-dealer, funding portal, or investment adviser; nothing here is investment advice or an offer to sell securities. Verify all figures against the linked EDGAR filings.