
WinSanTor
OperatingBiotech · San Diego, CA
Ensuring no one suffers from Peripheral Neuropathy
Financials
FY2016–FY2024 (no data for FY2020) · from SEC filings · hover any figure for its sourceFigures as reported by the issuer in the filing shown on hover. Each year’s pill shows the assurance level of its filed statements — audited, reviewed (CPA review, less than an audit), or unaudited, as the filing’s own report or certification states it. A dashed pill marked * is inferred instead: the SEC minimum for an offering that size, which the issuer may have exceeded. No pill means we couldn’t tell. Headcount is the filing’s point-in-time count, not a year-end average. Manually corrected figures are marked “Corrected”.
Valuation over rounds
Valuation caps on SAFE / convertible note roundsDashed amber bars are a SAFE or convertible note's valuation cap — the most it converts at, not what the company is worth.
Fundraising history
Team
13 people
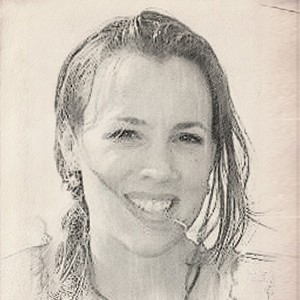
Angela has spent 20 years in pharmaceutical/drug development operations. Her previous industry experience includes positions in both discovery and developmental research. Her program lifecycle management experience includes all areas of development such as CMC, preclinical and clinical activities. She has successfully driven compounds from lead optimization through late stage clinical trials to NDA submission. Angela's primary job is with the Company and she works there 40 hours a week.
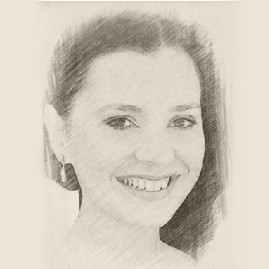
Katie Frizzi Lynch graduated from Georgia State University with a B.S. in Psychology in 2008. After graduation, she worked in a neuroscience lab at Georgia State University studying the neurotransmitters involved in the mating and feeding behaviors of garter snakes. Katie then began working as a researcher at UCSD in 2009. The focus of her research is neuropathy, including diabetic, chemo-induced, and HIV-induced neuropathy. She received her Master’s of Advanced Studies degree in Clinical Research through the UCSD School of Medicine in 2017. Her Master’s thesis centered on different quantification methods for measuring skin fibers in differing neuropathic populations.
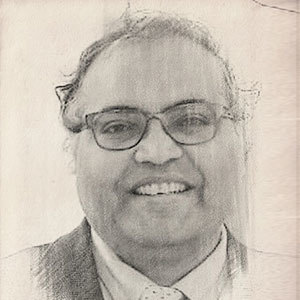
Lakshmi is the Director at the Center for Molecular Design and Preformulations at the University Health Network and is an Associate Professor of Medicinal Chemistry at the University of Toronto. Dr. Kotra is an expert in drug discovery and development and is also an entrepreneur with international experience.
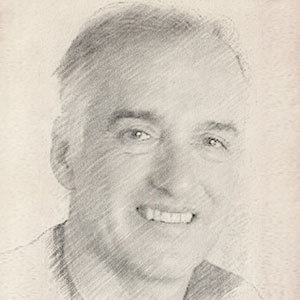
Nigel is the Professor of Pathology at the University of California San Diego (UCSD) and has studied peripheral neuropathy since his undergraduate studies with one of the scientific founders of the field, David Tomlinson, in 1983. He has been involved in the preclinical/clinical development of multiple therapeutic programs and is a KOL for companies engaged in drug development. He also served as the lead preclinical contactor to the NIH NIDDK-RAID program and is a member of the Executive Committee of the EASD Neurodiab Study Group. His primary job is with University Health Network (University of Toronto) but he works with the company 1-2 hours a week.
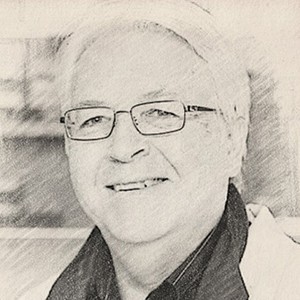
Paul is the Chairman of the Department of Pharmacology & Therapeutics as well as a professor at the University of Manitoba. He is also the Director of Division of Neurodegenerative Diseases at the St. Boniface Hospital Research Centre, Winnipeg. He has worked for 30 years on nerve cell biology and in the diabetic neuropathy field studying the etiology of the disease using in vitro and in vivo approaches. He invented the in vitro drug screen assay utilizing primary sensory neurons that identified the drugs currently under investigation. His primary job is with Division of Neurodegenerative Diseases at the St. Boniface Hospital Research Centre, Winnipeg but he works with the company for 1-2 hours a week.
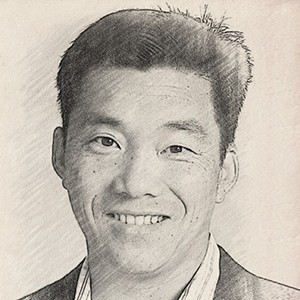
Stanley is a seasoned entrepreneur and the founder of companies in diverse industries, including pharmaceutical/biotechnology, medical device and software. His first company, SoftMax, was acquired by Qualcomm and his second company, Emotient, was acquired by Apple. Both technologies now reside on most smart phones. Stanley's only position is with the Company.
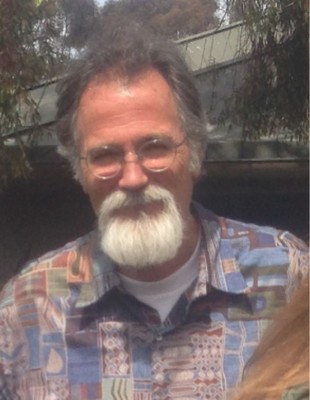
Andrew is a Professor Emeritus of the Department of Pathology, University of California San Diego, having received his B.S. in Wildlife Biology from Humboldt State University and a Ph.D. from the Department of Developmental and Cell Biology at the University of California, Irvine. Andrew spent his academic career studying the pathophysiology of the peripheral nerve microenvironment in toxic, metabolic and immune-mediated neuropathies and published over 90 research articles in this area, including the first detailed descriptions of neuropathy in wild loggerhead sea turtles (Caretta caretta) and diabetic domestic cats. He works part time and contributes approxmiately 10 hours a week to the company.
Show 4 more peopleShow fewer
Names and titles as disclosed on StartEngine, SEC Form C. Bios and photos come from the platform campaign page and may be out of date.
Reg CF annual-report compliance
Filed 3 of 8 annual reports (FY2018–FY2025)
Reg CF issuers must file a Form C-AR each year until a Rule 202(b) termination trigger is met.
SEC filings
View all 10 filings on EDGAR- Form C-ARApr 23, 20250001670254-25-000404EDGAR
- Form CAug 2, 20230001670254-23-000740EDGAR
- Form C-ARJun 11, 20200001670254-20-000472EDGAR
- Form C-WMay 5, 20200001665160-20-000571EDGAR
- Form CMar 12, 20200001665160-20-000220EDGAR
- Form C-UFeb 28, 20200001665160-20-000173EDGAR
- Form C-ARFeb 26, 20200001665160-20-000159EDGAR
- Form C/AFeb 12, 20190001670254-19-000062EDGAR
About this data. Figures are compiled from public sources — SEC EDGAR filings (Form C, C-AR, 1-A, 1-K) and funding-platform pages — and may be delayed, incomplete, or restated by the issuer. Financial statements are as reported by the issuer; each year is labeled with its assurance level (audited / reviewed / unaudited). A valuation cap is the conversion ceiling of a SAFE or convertible note, not an agreed company valuation; post-money figures are computed as pre-money plus amount raised and are not a traded price. Crowdonomics is not a broker-dealer, funding portal, or investment adviser; nothing here is investment advice or an offer to sell securities. Verify all figures against the linked EDGAR filings.