

Worthy Financial
OperatingWorthy Financial, Inc
Fintech · Boca Raton, FL
Helping to Save and Grow Your Money You're Worthy of a Better Return
Financials
FY2016–FY2025 · from SEC filings · hover any figure for its sourceChart shows the most recent 8 fiscal years; 2 earlier years are in the table below.
Figures as reported by the issuer in the filing shown on hover. Each year’s pill shows the assurance level of its filed statements — audited, reviewed (CPA review, less than an audit), or unaudited, as the filing’s own report or certification states it. A dashed pill marked * is inferred instead: the SEC minimum for an offering that size, which the issuer may have exceeded. No pill means we couldn’t tell. Headcount is the filing’s point-in-time count, not a year-end average. Manually corrected figures are marked “Corrected”.
Valuation over rounds
Pre-money — the valuation set before each round’s money came inBlue bars are the pre-money valuation the company stated for a priced round. Dotted grey bars are our estimate for rounds that didn't state one: the round's share price × the shares outstanding in its filings. Same measure as blue, but rougher.
Cap table
Share counts as of Dec 31, 2025| Class | Outstanding | Votes / share | Share of total | Last price |
|---|---|---|---|---|
| Common Stock | 2,397,555 | — | 100.0% | $2.50Jul 2018 |
Shares outstanding over timein today's share terms
Changes in named holdersshares in today's terms · % of all shares at the time
- Sally Outlaw875K (33.7%) Apr 2019 → 1.1M (40.6%) Oct 2020
Principal holders% as the filing states it, May 25, 2021
- Sally Outlaw1,073,196 Common Stock38.7%of company
- Alan & Susan Jacobs544,742 Common Stock19.6%of company
- Jack W. Richards & Susan Richards380,712 Common Stock13.7%of company
Sold to the crowd
- Reg CF · Jul 2018106,896 shares at $2.50 in today's terms · sold as 53,448 shares at $5.00; since then a 2-for-1 split (Dec 2020)$267.2K· 414 investors
From the company's SEC filings: share counts per class, each class's voting and conversion terms, and the holders of 20% or more that Form C requires (officers and 10%+ holders on Form 1-A). Filings name only large holders, so most owners — including crowd investors — are not listed, and a holder's percentage may be of its own class rather than of the whole company. Prices and crowd share counts are in today's share terms — adjusted for splits and conversions since they were sold. Hover a figure for its filing.
Fundraising history
Team
12 people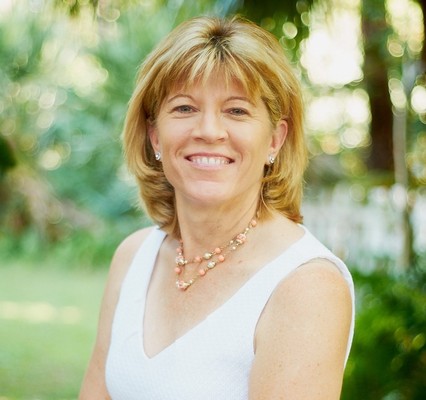
A life-long entrepreneur passionate about opening up economic opportunity for all. Sally has served as the full time President, Director, Founder and CEO of Worthy Financial since January 2016. She co-founded Peerbackers in 2010, an online crowdfunding platform with a focus on entrepreneurs. After four years and thousands of projects funded, the company moved beyond the platform and into services to help clients navigate the world of Crowd Finance.
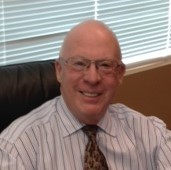
Alan has more than 40 years of experience as a corporate and securities attorney, investment banker, business and financial advisor, and entrepreneur/senior executive of both private and public companies. Mr. Jacobs has been an investment banker and owner of licensed broker/dealers in New York and Florida specializing in financing and advisory services of growing companies primarily in healthcare and technology. He has been responsible for raising more than $750 million for a wide range of companies and is a graduate of Franklin and Marshall College and Columbia Law School. Before joining Worthy Financial full time in 2016, Mr. Jacobs held positions at Safer Science Technologies, as a Director of Business Development, from June 2015 through December 2016. Safer Science Technologies is an environmentally, friendly cleaning products company.
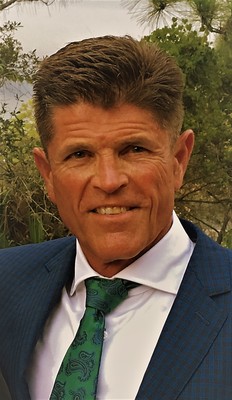
Jack delivers a diverse background in management, marketing and product development. He is an inventor and successful founder, or co-founder, of start-ups in the areas of commodity trading, sports marketing and energy. As a serial entrepreneur, he is an investor and board of director member for several companies and is a graduate of Texas Tech University with a degree in Agricultural Economics. His prior position was serving as Vice President at Titan Lansing Tansloading fro 2014 to 2017. Jack serves as a Director and spends 8 hours a week with Worthy Financial.
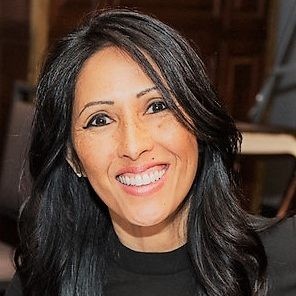
Jang contributes more than 25 years of operational and management experience in a variety of consumer service industries, including hospitality, banking and education. She has also been a principal in an independent financial services advisory firm and with a small business management company. Jang has been with Worthy Financial full time since 2016, serving as an Administrative and Customer Service Manager Du20 Holistic Oasis from 2012-2015 prior.
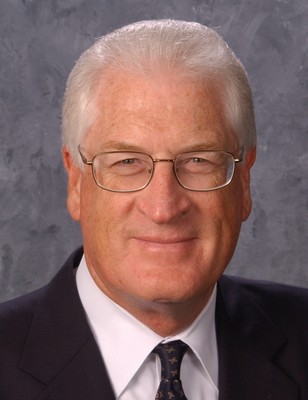
Randy brings his Ph.D in Finance, his decades of experience in management at both public and private companies, as well as his breadth of experience as the Dean of the H. Wayne Huizenga School of Business at Nova Southeastern University (since 2009) and Dean of Kansas State University, College of Business Administration. He also served as a Visiting Research Scholar at the University of California, Los Angeles, and was a member of the Executive Advisory Board of the Wharton School of the University of Pennsylvania. Randy serves as a Director and spends 8 hours a week with Worthy Financial.

Show 3 more peopleShow fewer
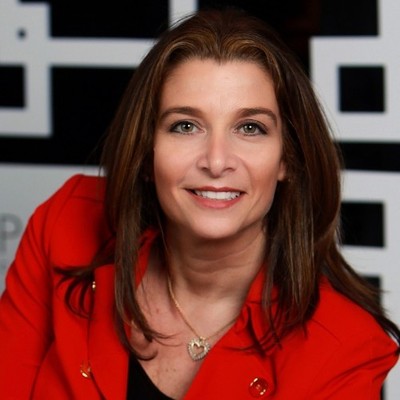
Names and titles as disclosed on SEC Form 1-A, SEC Form C, StartEngine. Bios and photos come from the platform campaign page and may be out of date.
Reg CF annual-report compliance
Filed 8 of 8 annual reports (FY2018–FY2025)
Reg CF issuers must file a Form C-AR each year until a Rule 202(b) termination trigger is met.
SEC filings
View all 23 filings on EDGAR- Form C-ARApr 27, 20260001493152-26-019136EDGAR
- Form C-ARApr 29, 20250001641172-25-006618EDGAR
- Form C-ARApr 30, 20240001493152-24-017079EDGAR
- Form C-ARApr 28, 20230001493152-23-013922EDGAR
- Form C-ARApr 27, 20220001493152-22-011305EDGAR
- Form 1-A/AMay 25, 20210001493152-21-012873EDGAR
- Form C-ARApr 30, 20210001493152-21-010163EDGAR
- Form 1-A/AMar 15, 20210001493152-21-006005EDGAR
About this data. Figures are compiled from public sources — SEC EDGAR filings (Form C, C-AR, 1-A, 1-K) and funding-platform pages — and may be delayed, incomplete, or restated by the issuer. Financial statements are as reported by the issuer; each year is labeled with its assurance level (audited / reviewed / unaudited). A valuation cap is the conversion ceiling of a SAFE or convertible note, not an agreed company valuation; post-money figures are computed as pre-money plus amount raised and are not a traded price. Crowdonomics is not a broker-dealer, funding portal, or investment adviser; nothing here is investment advice or an offer to sell securities. Verify all figures against the linked EDGAR filings.