
Yerbaé
OperatingYerbae Brands Co., Inc.
Food & Beverage · Packaged Drink · Scottsdale, AZ · Founded 2020
PLANT-BASED Enhanced Sparkling Water
Financials
FY2018–FY2022 · from SEC filings · hover any figure for its sourceFigures as reported by the issuer in the filing shown on hover. Each year’s pill shows the assurance level of its filed statements — audited, reviewed (CPA review, less than an audit), or unaudited, as the filing’s own report or certification states it. A dashed pill marked * is inferred instead: the SEC minimum for an offering that size, which the issuer may have exceeded. No pill means we couldn’t tell. Headcount is the filing’s point-in-time count, not a year-end average. Manually corrected figures are marked “Corrected”.
Valuation over rounds
Pre-money — the valuation set before each round’s money came inBlue bars are the pre-money valuation the company stated for a priced round.
Share price over rounds
Disclosed sales come from the issuer's own filings (prior-offering lines, audited-statement notes) and are amount ÷ securities sold. A down round is a firm point more than 25 % below the previous firm point of the same share class on a comparable basis; the comparison ignores unverified and year-only lines.
Cap table
Share counts as of Dec 31, 2021| Class | Outstanding | Votes / share | Share of total | Last price |
|---|---|---|---|---|
| Common stock | 404,032 | — | 100.0% | — |
Shares outstanding over timein today's share terms
Sold to the crowd
- Reg CF · Sep 2020482,381 shares at $2.14$1M· 1,128 investors
- Reg CF · Jun 2022102,560 shares at $1.37$140.5K· 107 investors
From the company's SEC filings: share counts per class, each class's voting and conversion terms, and the holders of 20% or more that Form C requires (officers and 10%+ holders on Form 1-A). Filings name only large holders, so most owners — including crowd investors — are not listed, and a holder's percentage may be of its own class rather than of the whole company. Prices and crowd share counts are in today's share terms — adjusted for splits and conversions since they were sold. Hover a figure for its filing.
Fundraising history
Team
4 people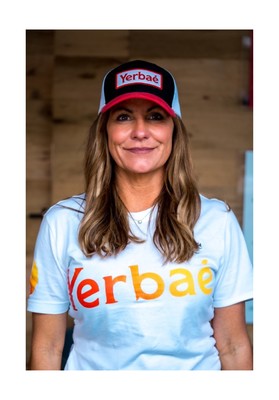
Karrie believes that integrity, honesty, and hard work are key traits for growing a successful business. She has overcome numerous challenges along her entrepreneurial journey by staying focused on a vision, handling issues head-on, and surrounding herself with quality people. Her strong research orientation, emphasis on effective team leadership, board experience, and unique problem-solving approach have served her well in creating a winning company culture. It is this same tenacity and commitment to excellence that helped her launch Yerbaé and will ensure its status as a leader in the beverage industry.
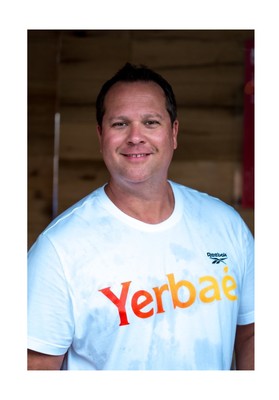
Todd is an accomplished beverage industry entrepreneur, innovator, business builder, and sales leader who, in partnership with his wife, Karrie, is growing the Yerbaé brand. To this venture, he brings laser-sharp customer focus, a rock-solid work ethic, and depth and breadth of experience in business development, marketing, merchandising, vendor management, and operations. Having helped build three companies from the ground up that were sold to Coca Cola and Pepsi, Todd knows what it takes to successfully bring a product to market in the highly-competitive functional and wellness beverage industry.

Brian is a highly decorated and accomplished marketer having led iconic brands in the OTC Beauty and Food & Beverage industries. His extensive knowledge and experience in building beloved brands is fueling the development of Yerbaé into a household name. His drive and energy coupled with his incredible track record at companies like Kraft Heinz and Johnson & Johnson chalk-full of industry firsts make him the ideal leader to take Yerbaé to the next level.
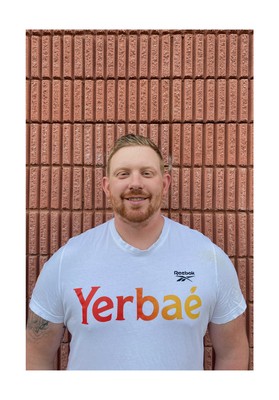
Seth is an accomplished Beverage and Electronics industry entrepreneur. Using his leadership skills in sales management and his fearless nature for hunting he is Yerbaé's version of the ultimate fighter for new retailers and customers. Seth's knowledge and experience in proven sales methods and execution, has helped pave strategic paths to growth in two prior business acquisitions.
Names and titles as disclosed on SEC Form C, StartEngine. Bios and photos come from the platform campaign page and may be out of date.
Reg CF annual-report compliance
Filed 3 of 6 annual reports (FY2020–FY2025)
Reg CF issuers must file a Form C-AR each year until a Rule 202(b) termination trigger is met.
SEC filings
View all 13 filings on EDGAR- Form C-ARMay 2, 20230001665160-23-001160EDGAR
- Form C-UOct 4, 20220001665160-22-002583EDGAR
- Form DSep 16, 20220001823354-22-000001EDGAR
- Form CJun 15, 20220001665160-22-001804EDGAR
- Form C-ARApr 27, 20220001665160-22-000975EDGAR
- Form C-AR/ADec 27, 20210001665160-21-002363EDGAR
- Form C-UNov 9, 20210001665160-21-001977EDGAR
- Form C-UMay 25, 20210001665160-21-000979EDGAR
About this data. Figures are compiled from public sources — SEC EDGAR filings (Form C, C-AR, 1-A, 1-K) and funding-platform pages — and may be delayed, incomplete, or restated by the issuer. Financial statements are as reported by the issuer; each year is labeled with its assurance level (audited / reviewed / unaudited). A valuation cap is the conversion ceiling of a SAFE or convertible note, not an agreed company valuation; post-money figures are computed as pre-money plus amount raised and are not a traded price. Crowdonomics is not a broker-dealer, funding portal, or investment adviser; nothing here is investment advice or an offer to sell securities. Verify all figures against the linked EDGAR filings.