

ZenSpace
OperatingZenSpace Inc
Industrial & Manufacturing · Manufacturing · San Jose, CA · Founded 2017
On-Demand WorkSpace. Anytime. AnyPlace.
Financials
FY2016–FY2022 · from SEC filings · hover any figure for its sourceFigures as reported by the issuer in the filing shown on hover. Each year’s pill shows the assurance level of its filed statements — audited, reviewed (CPA review, less than an audit), or unaudited, as the filing’s own report or certification states it. A dashed pill marked * is inferred instead: the SEC minimum for an offering that size, which the issuer may have exceeded. No pill means we couldn’t tell. Headcount is the filing’s point-in-time count, not a year-end average. Manually corrected figures are marked “Corrected”.
Valuation over rounds
Pre-money — the valuation set before each round’s money came inBlue bars are the pre-money valuation the company stated for a priced round.
Share price over rounds
Disclosed sales come from the issuer's own filings (prior-offering lines, audited-statement notes) and are amount ÷ securities sold. A down round is a firm point more than 25 % below the previous firm point of the same share class on a comparable basis; the comparison ignores unverified and year-only lines.
Cap table
Principal holders% as the filing states it, May 2, 2023
- Mayank Agrawal9,500,000 Common Stock65.4%of
Sold to the crowd
- Reg CF · Dec 2018698,708 shares at $0.4723$330K
- Reg CF · Jun 2020383,883 shares at $0.75$287.9K· 291 investors
From the company's SEC filings: share counts per class, each class's voting and conversion terms, and the holders of 20% or more that Form C requires (officers and 10%+ holders on Form 1-A). Filings name only large holders, so most owners — including crowd investors — are not listed, and a holder's percentage may be of its own class rather than of the whole company. Prices and crowd share counts are in today's share terms — adjusted for splits and conversions since they were sold. Hover a figure for its filing.
Fundraising history
Team
10 people
Jim Young is the co-founder of Realcomm Conference Group, a worldwide research and event company at the intersection of technology, innovation and real estate operations. Jim offers high insight and network as he regularly works with some of the largest companies globally in real estate projects under development.

Mayank Agrawal has a background in engineering and sales in high-tech industry working with leading tech companies like STMicroelectronics. As CEO of ZenSpace, he is reimagining the flexible workspace and coming up with innovative technology-driven to improve the spaces in which we work. His background in software and technology-enabled him and his team to develop the worlds first SmartPods and Instant Business Lounge solutions.

Ted Simon has a breadth of experience in sales and strategy where he has supported some of the of the best-known of the Fortune 500 brands such as Nestle, Pillsbury, Procter & Gamble, and Kraft Food - to name a few. As VP of Sales and Business Development at ZenSpace, he excels in cross-category insights - offering solutions for the intertwined needs of ZenSpace's B2B and B2C customers.
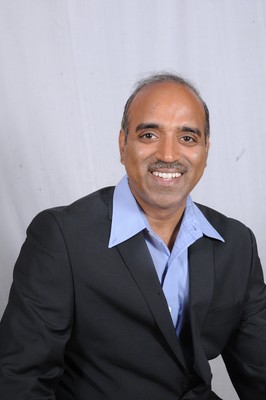
Gopi Mohan has over 23+ years of experience in Telecom, Networking, SDN, Virtualization, Security, and IoT domain. As Vice President of Technology, Gopi manages our Smart Meeting Room kit covering Network and IoT engineering solutions. Gopi works 30 hours per week at ZenSpace.

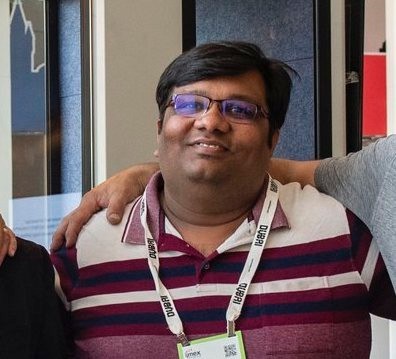
Rohit brings over 17+ years experience in the field of technology to the team. As Director of Software Engineering, he streamlines our software to create solutions for ZenSpace's customers, clients and vendors. His love for technology makes him agile when it comes to finding everyday solutions in software development.

Alessandra Mantovani has ten years experience in brand management - where she has developed award-winning brands and visual storytelling. As ZenSpace's Business Development Manager, Alessandra is integral to developing the team's go-to-market strategy, product innovation, and sales outreach.

Raghuveer Tarra is the VP of Engineering at Roku, a leading consumer tech company in the OTT space. He has been part of the founding team of leading technology companies like Sling Media and GigSky. As a ZenSpace board member, Raghuveer brings great insight as an accomplished technology executive with more than 25 years of experience in building Consumer Electronics, Telecom, IoT, and other SaaS products. Raghuveer contributes one hour per week to ZenSpace.

Sia has 14 years of experience in Business Administration and HR Operations. As Operations Manager at ZenSpace, Sia excels at communication across teams, project facilitation, and creating seamless operational standards. Sia currently works 15-20 hours per week at ZenSpace.
Show 1 more personShow fewer

Umang has 9+ years of experience in digital marketing and specializes in lead generation through various channels. Umang is ZenSpace's marketing manager where she excels at website management and planning, CRM, marketing automation, google analytics, social media management and search engine optimization.
Names and titles as disclosed on StartEngine, SEC Form C. Bios and photos come from the platform campaign page and may be out of date.
Reg CF annual-report compliance
Filed 5 of 8 annual reports (FY2018–FY2025)
Reg CF issuers must file a Form C-AR each year until a Rule 202(b) termination trigger is met.
SEC filings
View all 23 filings on EDGAR- Form C-ARMay 2, 20230001665160-23-001173EDGAR
- Form C-ARApr 27, 20220001665160-22-000957EDGAR
- Form C-UOct 18, 20210001665160-21-001828EDGAR
- Form C-UOct 1, 20210001665160-21-001770EDGAR
- Form C/ASep 13, 20210001665160-21-001634EDGAR
- Form C/AJul 26, 20210001665160-21-001321EDGAR
- Form C/AJul 8, 20210001665160-21-001222EDGAR
- Form C-AR/AJun 21, 20210001665160-21-001136EDGAR
About this data. Figures are compiled from public sources — SEC EDGAR filings (Form C, C-AR, 1-A, 1-K) and funding-platform pages — and may be delayed, incomplete, or restated by the issuer. Financial statements are as reported by the issuer; each year is labeled with its assurance level (audited / reviewed / unaudited). A valuation cap is the conversion ceiling of a SAFE or convertible note, not an agreed company valuation; post-money figures are computed as pre-money plus amount raised and are not a traded price. Crowdonomics is not a broker-dealer, funding portal, or investment adviser; nothing here is investment advice or an offer to sell securities. Verify all figures against the linked EDGAR filings.