

Zenus, Inc.
OperatingHealthcare · Austin, TX · Founded 2015
Video analysis on a massive scale
Financials
FY2018–FY2024 (no data for FY2021) · from SEC filings · hover any figure for its sourceFigures as reported by the issuer in the filing shown on hover. Each year’s pill shows the assurance level of its filed statements — audited, reviewed (CPA review, less than an audit), or unaudited, as the filing’s own report or certification states it. A dashed pill marked * is inferred instead: the SEC minimum for an offering that size, which the issuer may have exceeded. No pill means we couldn’t tell. Headcount is the filing’s point-in-time count, not a year-end average. Manually corrected figures are marked “Corrected”.
Valuation over rounds
Pre-money — the valuation set before each round’s money came inBlue bars are the pre-money valuation the company stated for a priced round.
Fundraising history
Team
6 people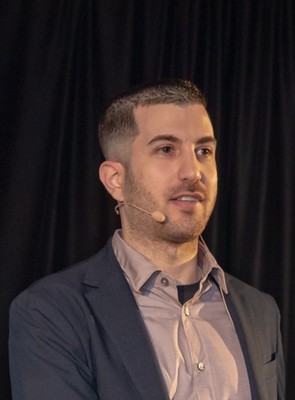
Panos Moutafis, Ph.D. has nine (9) years of experience in facial analysis and he is the co-founder and CEO of Zenus. He received his B.Sc. in Statistics from the Athens University of Economics & Business in Greece, and his Ph.D. in Computer Science from the University of Houston. He has published 10 research papers in leading journals and conferences which have been cited over 80 times, co-authored a book chapter in Face Recognition Across the Imaging Spectrum, and granted one US patent with one more pending. His distinctions include the IEEE Homeland Security Conference Biometrics, Forensics, and Physical Security best paper award. He serves on the advisory board at the Lone Star College, enjoys mentoring early stage founders, and offers talks to schools and universities about careers in science and technology.
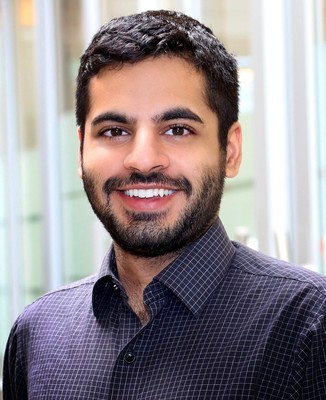
Rakshak Talwar is the co-founder and CTO of Zenus. He earned his B.Sc. in Computer Engineering from the University of Houston and has a decade of startup experience, ranging from robotics to artificial intelligence. His areas of expertise include deep learning, machine intelligence, computer vision, and electronics engineering. He is a co-inventor for one pending US patent.

Kaleb is a Full-Stack Engineer at Zenus and holds a Bachelors in Computer Science from Mississippi State University. He has diverse experience in multiple areas including hardware test engineering, network penetration testing, front-end, and back-end software development, and DevOps.
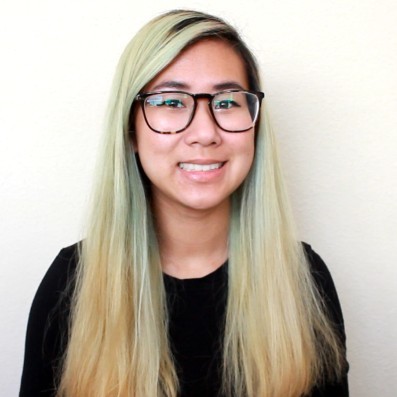
Mary earned her B.S. in Hotel & Restaurant Management and a minor in Marketing. At Zenus, she manages the company's social media, develops case studies and creates infographics. She also designs and maintains the company's website. Her work experience ranges from hospitality operations, technical support, B2B sales, and training development.
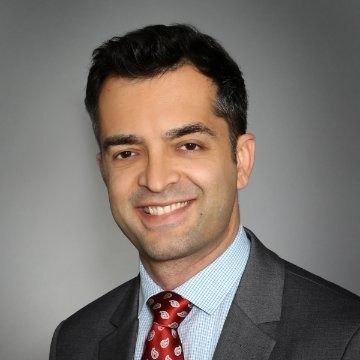
Rahul Bijlani, along with his partner, Michael Yu, joined CBRE in the firm's Houston offices in February 2016 to lead CBRE Hotels South Central United States. His team has transacted $1+ Billion of hospitality real estate, and uniquely serves both private clients and institutional investors. Rahul’s team has executed all over the United States, with a specialization in Texas assets. In the tech startup world, he is an active Angel and Series A investor, serves as an advisor to Apto – the leading commercial real estate CRM – and co-founded YBIntel, which seeks to improve competitive tracking analytics for the hotel and beverage industry in Texas. Rahul also serves on the board of Zenus, which is using facial analytics to disrupt the events industry. Prior to joining CBRE Hotels, Rahul and Michael led the #1 National Hospitality Group team at Marcus & Millichap nationwide where they completed over 70% of all hotel sales by Marcus & Millichap in Texas and Louisiana. Rahul graduated Magna Cum Laude from the University of Rochester in New York, with degrees in Economics and Computer Science, and worked in Los Angeles at a bioinformatics startup prior to joining Marcus & Millichap in Houston in 2005.
Names and titles as disclosed on StartEngine, SEC Form C. Bios and photos come from the platform campaign page and may be out of date.
Reg CF annual-report compliance
Filed 3 of 6 annual reports (FY2020–FY2025)
Reg CF issuers must file a Form C-AR each year until a Rule 202(b) termination trigger is met.
SEC filings
View all 11 filings on EDGAR- Form C-TRApr 21, 20250001665160-25-000730EDGAR
- Form C-ARApr 16, 20250001665160-25-000690EDGAR
- Form C-ARApr 19, 20240001665160-24-000407EDGAR
- Form C-UJan 3, 20220001665160-22-000008EDGAR
- Form C/ASep 28, 20210001665160-21-001706EDGAR
- Form C/AJun 28, 20210001665160-21-001189EDGAR
- Form C-ARApr 30, 20210001665160-21-000859EDGAR
- Form C/AMar 29, 20210001665160-21-000383EDGAR
About this data. Figures are compiled from public sources — SEC EDGAR filings (Form C, C-AR, 1-A, 1-K) and funding-platform pages — and may be delayed, incomplete, or restated by the issuer. Financial statements are as reported by the issuer; each year is labeled with its assurance level (audited / reviewed / unaudited). A valuation cap is the conversion ceiling of a SAFE or convertible note, not an agreed company valuation; post-money figures are computed as pre-money plus amount raised and are not a traded price. Crowdonomics is not a broker-dealer, funding portal, or investment adviser; nothing here is investment advice or an offer to sell securities. Verify all figures against the linked EDGAR filings.